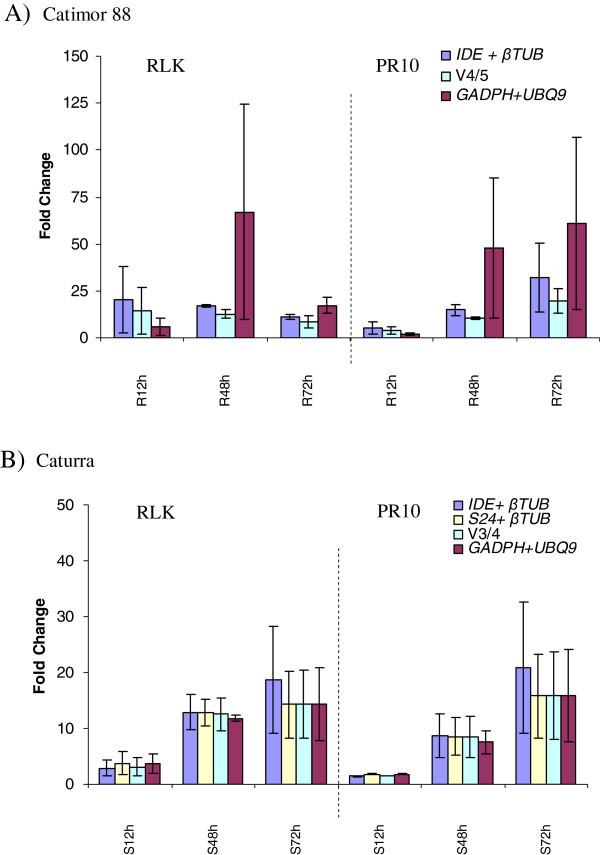
Figure 2.
RLK and PR10 expression in Catimor 88 (A) and Caturra (B) inoculated with C. kahawae at 12, 48 and 72hpi. Three normalization strategies are presented: two best RGs from the comprehensive ranking; GeNorm V value from pairwise variation analysis and the two worst RGs from the comprehensive ranking (GADPH and UBQ9). Median and SD values of two biological replicates are presented. In Figure 2A, R - resistant genotype; in Figure 2B, S – susceptible genotype.

