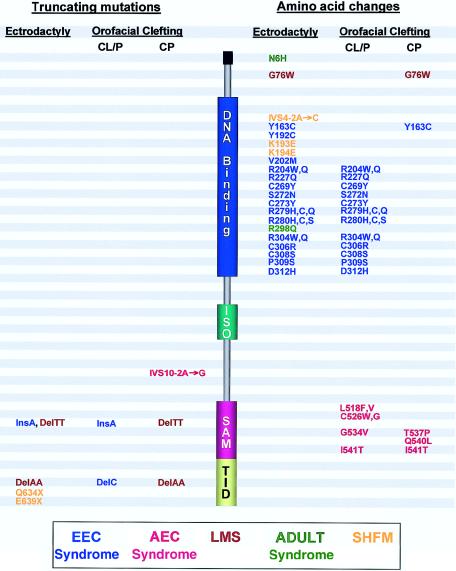
Figure 3.
Distribution of mutations in p63, revealing a genotype-phenotype correlation. The approximate positions of truncating mutations (left) and amino acid changes (right) are indicated, together with the associated phenotype, with respect to the occurrence of ectrodactyly and the type of facial clefting. (For discussion, see text.) DNA binding = DBD; ISO = ISO domain; SAM = SAM domain.

