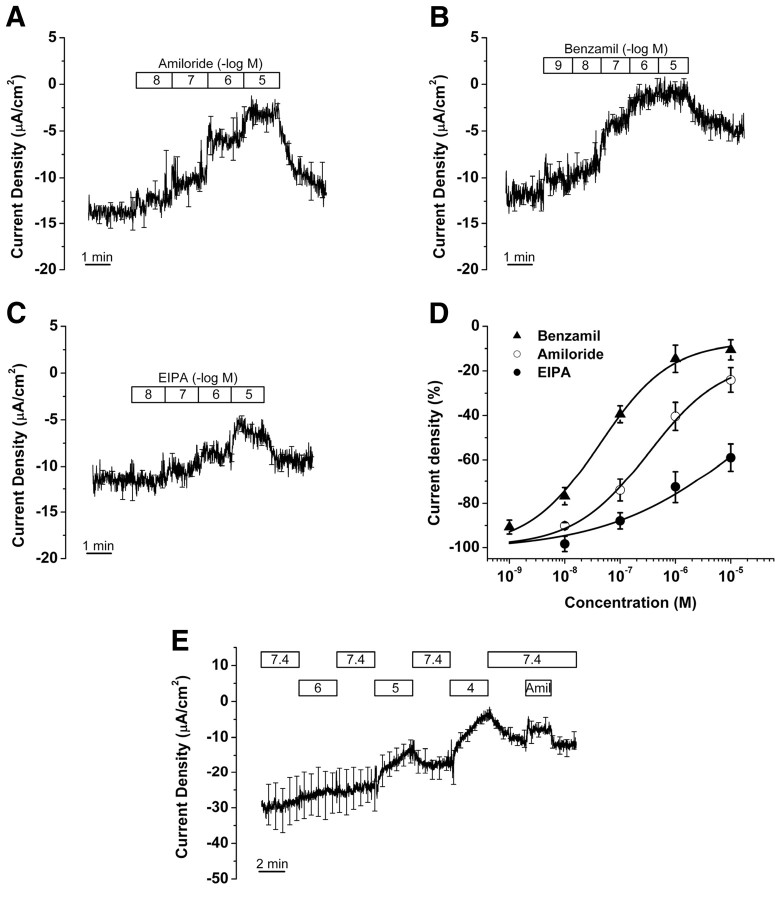
Figure 3.
Effect of Na+ transport inhibitors on current from saccular extramacular epithelium. A, Amiloride (n = 5); bars show duration of perfusion at concentrations (molar) expressed as the negative log of the number in the bar. B, Benzamil (n = 5). C, EIPA (n = 5). D, Concentration–response relationships. E, pH 6, 5, and 4 and 1 μm amiloride (n = 4); bars show the duration of perfusion at the pH values in the bar. Amiloride (Amil; 1 μm) was perfused at pH 7.4. Graphs in A–C and E are derived from averages at each time point at 500 ms intervals of all experiments; the SE bars are drawn only at larger intervals for clarity.

