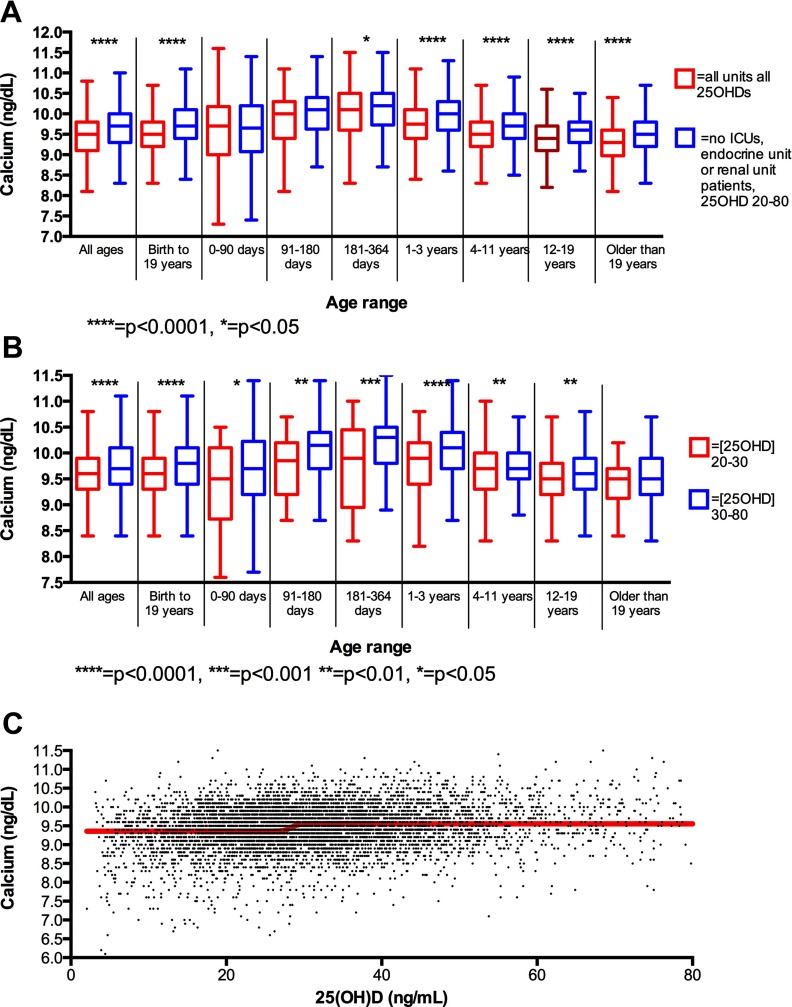
Figure 1.
Calcium concentrations by age and 25(OH)D. A, Calcium concentrations (nanograms per deciliter) in unselected subjects compared with subjects not on the endocrine unit, not on the renal unit, and not in an ICU with 25(OH)D between 20 and 80 ng/mL. B, Calcium concentrations (nanograms per deciliter) eliminating patients with endocrine or renal diagnoses, and in ICUs stratified by 25(OH)D. C, Unselected subjects with fitted dose-response curve; this curve revealed an inflection point at 28.4 with 95% confidence intervals ranging from 27.7 to 29.0, and an R2 value of 0.022.

