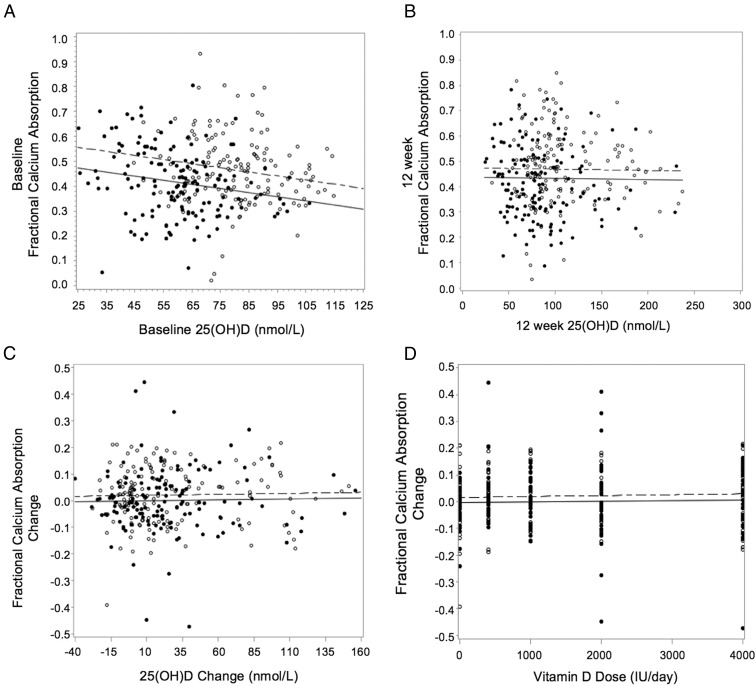
Figure 4.
A–C, Relationship between serum 25(OH)D and fractional calcium absorption at baseline (A) (serum 25(OH)D, P = .001; race [white vs black], P < .0001; slope = −0.002, R2 = 0.073, n = 297); 12 weeks (B) (25(OH)D, P = .13; race (white vs black), P < .0001; R2 = 0.071, n = 297) and (C) as change from baseline to 12 weeks (C) (25(OH)D, P = .66; race, P = .12; R2 = 0.013, n = 297). D, Relationship between vitamin D dose and change in fractional calcium absorption after 12 weeks of supplementation (vitamin D dose, P = .54; race, P = .12). Filled circles and solid lines indicate blacks, and open circles and dotted lines indicate whites.

