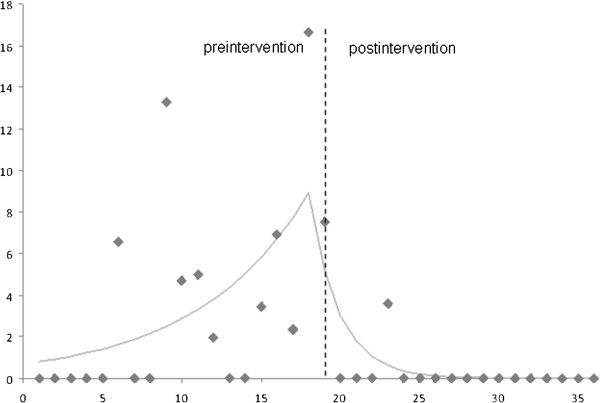
Figure 2.

Rates of Methicillin-resistant Staphylococcus aureus (MRSA) infections before and after the outbreak management strategy implemented at month 19. On the x axis, time (months); on the y axis, rate of MRSA infection (number for 1000 patient-days).
