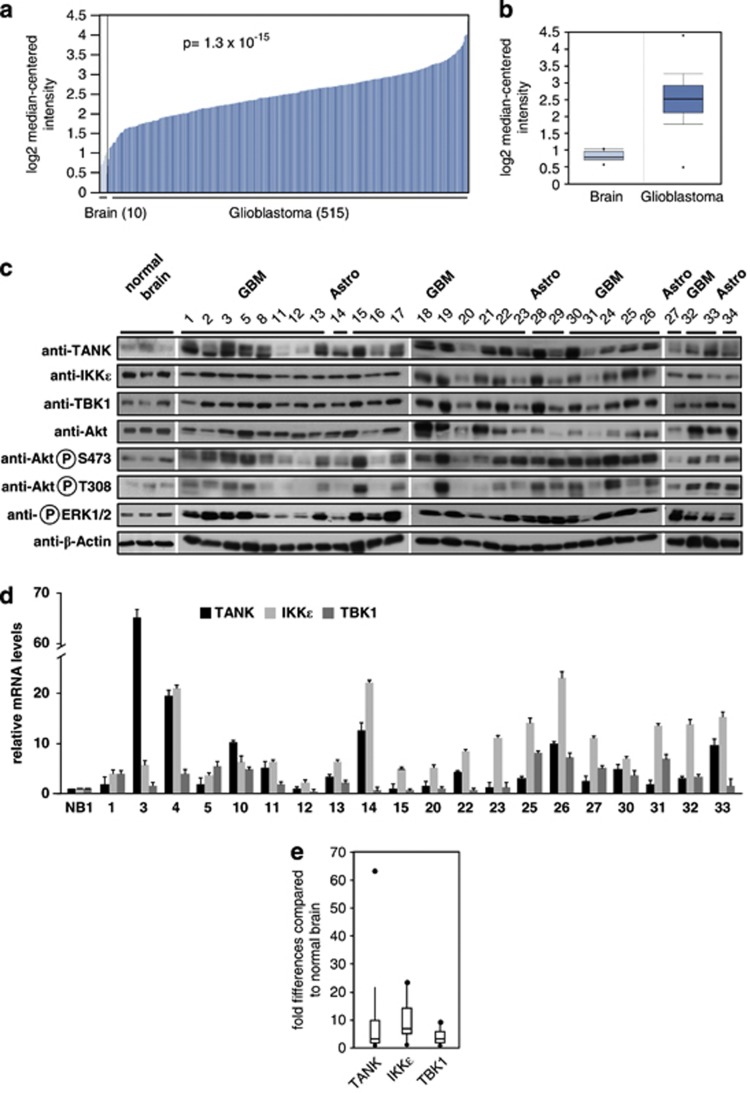
Figure 1.
Deregulated expression of members of the noncanonical IKK complex in GBMs. (a) Analysis of TANK expression in normal brain (light blue) and GBMs (dark blue). Each bar represents an individual tissue sample (Reporter ID: 209451_at; Nucleotide Acc. No.: U59863). (b) Box plots of data from the Oncomine data sets comparing healthy brains and GBMs plotted on a log scale. Median values are shown by horizontal bars, the upper part of the box shows 75th percentile and the lower part the 25th percentile. The upper part of the bar shows 90th percentile and the lower part the 10th percentile. The points show outlier values, the figure was created using the Oncomine 3.0 software. (c) Comparable amounts of total proteins extracted from GBMs, astrocytomas and healthy brain were separated by sodium dodecyl sulfate–polyacrylamide gel electrophoresis, sample numbers are shown at the top. After blotting to a membrane, the samples were analyzed by immunoblotting for the occurrence and phosphorylation state of the indicated proteins with specific antibodies. The antibodies detecting β-actin were used to ensure comparable protein loading. As the samples could not be analyzed on one gel, the displayed exposure times were chosen to allow direct comparison between the samples. (d) RNA was extracted from the indicated samples where available. After preparation of complementary DNA, the relative expression amounts of TANK, IKKɛ and TBK1 were determined by quantitative PCR (qPCR) using specific primers. Expression in normal brain (NB) was arbitrarily set as 1, error bars show standard deviations from two experiments performed in triplicate. (e) Box plot analysis of the data shown in (d). Horizontal bars show median values, vertical bars show the standard deviations and the points show outlier values.

