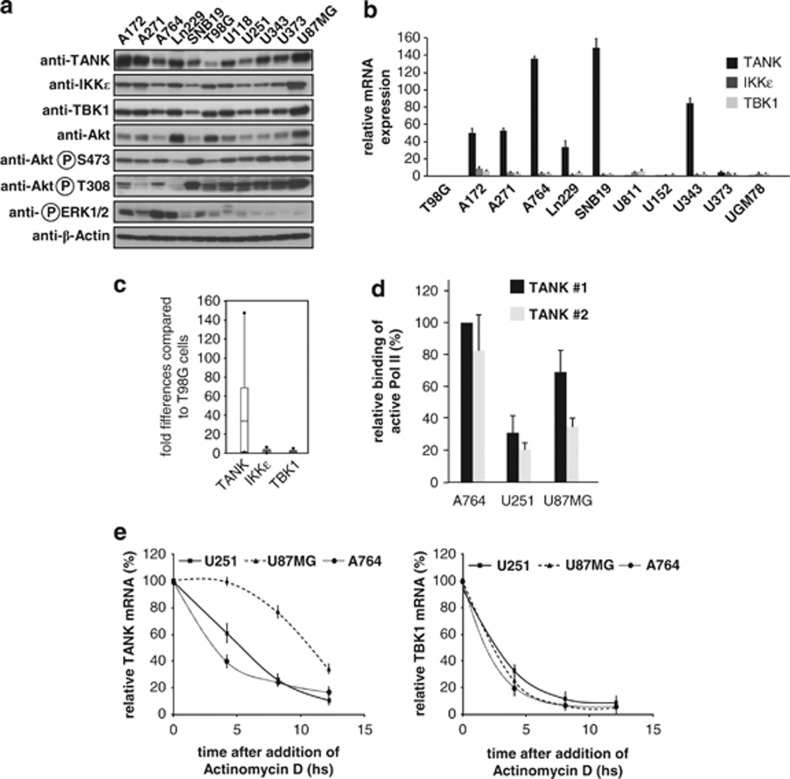
Figure 2.
Deregulated expression of members of the noncanonical IKK complex in glioma cell lines. (a) Equal amounts of proteins extracted from the indicated cell lines were analyzed by immunoblotting for expression and phosphorylation of the indicated proteins. Exposure times were chosen in a way that allows comparison between cell lines in the dynamic range of the film. (b) Comparative analysis of mRNAs encoding TANK, IKKɛ and TBK1. The mRNA levels were quantified in the indicated cell lines by quantitative PCR (qPCR). Expression levels in T98G cells were arbitrarily set as 1, error bars are derived from two experiments performed in triplicates. (c) Box plot analysis of the data shown in (b). Vertical bars show the standard deviations, horizontal bars show median values and the points show outlier values. (d) Proteins were crosslinked to the DNA with formaldehyde in the indicated cell lines and chromatin immunoprecipitation (ChIP) assays were performed using a Pol II phospho S2 antibody or an unspecific IgG control antibody. Binding of Pol II S2p to the Gapdh control and two regions (#1 and #2) in the Tank gene were quantified by qPCR. To allow a direct comparison between the cell lines, data were normalized for binding of phosphorylated Pol II to the Gapdh gene. Maximal binding of phosphorylated Pol II was arbitrarily set as 100%, standard deviations are shown. (e) The different cells were treated with actinomycin D (1 μg/ml) for the indicated periods, followed by RNA isolation, complementary DNA production and the analysis of expression levels by qPCR. Error bars show standard deviations from two experiments performed in triplicates.

