
Figure 5.
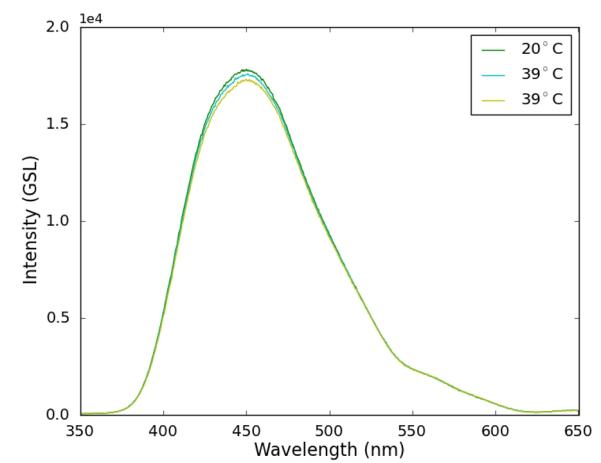
BCF-12 spectra. The spectrum intensity changed only slightly in the range of 400-500 nm. Owing to the close proximity of the spectral curves, only a staggered selection of data points is displayed to make the changes more visible. Other data points not shown here adhered well to the trend displayed above—see Figure 7.