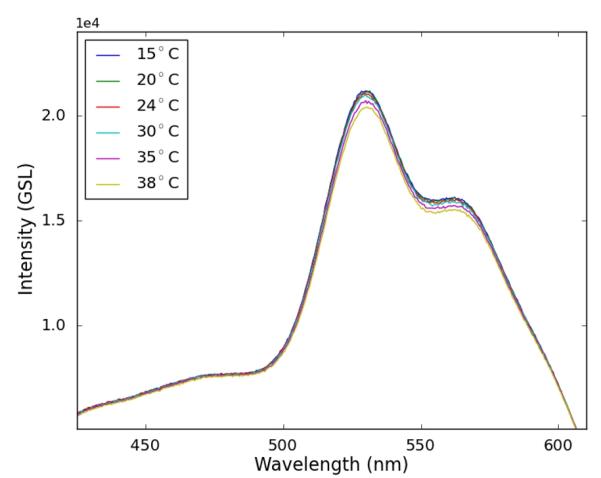
Figure 6.

Isolated optical coupling. A small temperature-dependent decrease was observed in the light transmitted through the cyanoacrylate coupling. Note that the limits of the x and y axis here differ from those of other spectra figures to give a magnified view of this spectrum.
