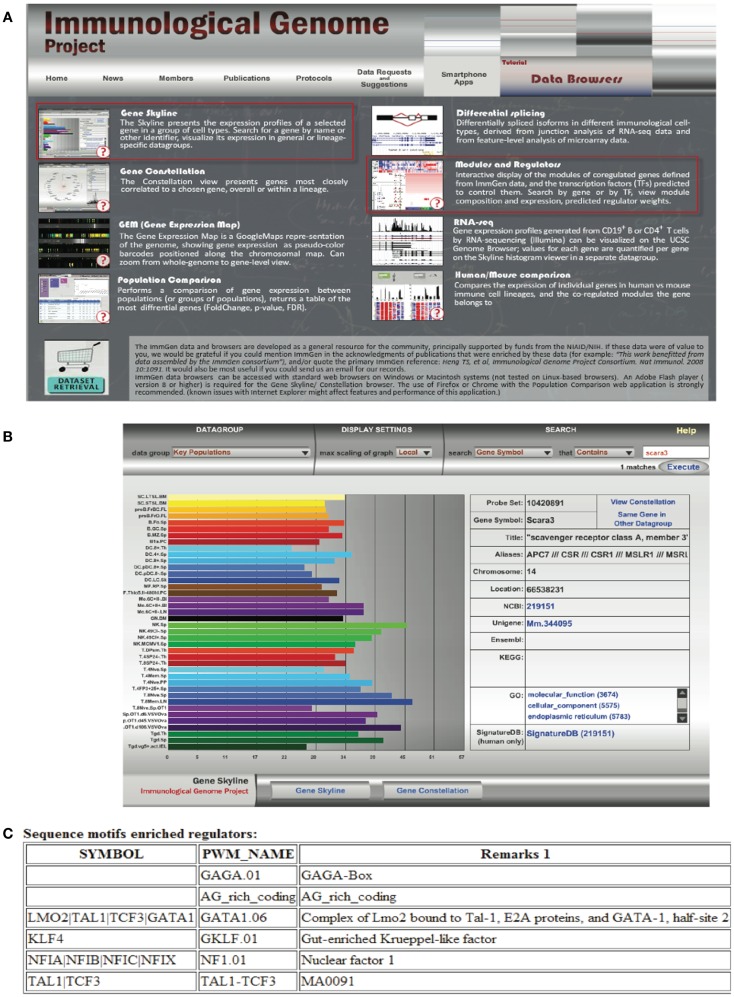
Figure 6.
Querying the Immunological Genome Project (http://immgen.org) for data on expression and transcriptional regulation of SCARA3. (A) The Immunological Genome project has a number of ways to browse the data and visualize patterns of gene expression and transcriptional regulation. (B) Using the “Gene Skyline” browser we see that the transcript for SCARA3 is expressed at low levels in most cell types in the database. (C) Using the “Modules and Regulators” browser we see that there are four predicted transcription factor binding sites (NF1.01, GATA1.06, GKLF.01, and TAL1-TCF3) and two regulatory regions (GAGA.01, AG_rich_coding) in the promotor of SCARA3.

