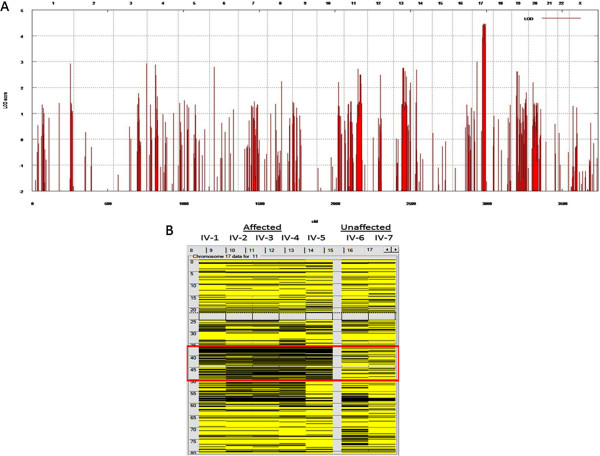
Figure 2.

Genome-wide linkage analysis with and homozygosity mapping 250 K Nsp I Affymetrix Gene Chips. (A) the locus on chromosome 17 was the only one to give the theoretical maximum for this pedigree. cM, centimorgan; LOD, logarithm of odds. (B) homozygosity mapping of KFS family via autoSNPa. Each column represents the homozygosity profile of one individual, and each row represents the call of an individual SNP on chromosome 17 (yellow, heterozygous; black, homozygous). Note the large run of homozygosity that is exclusively shared by the affected members (boxed in red).
