Figure 2.
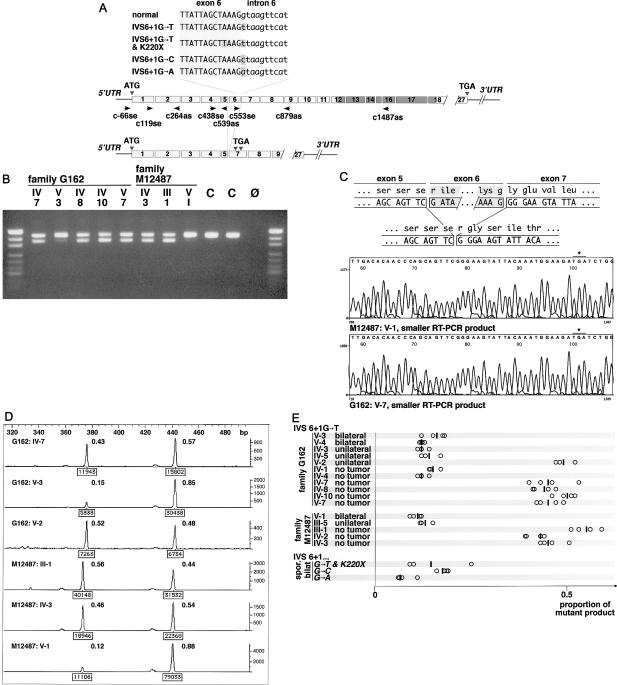
Results of RNA analysis. A, Genomic organization of RB1. Boxes indicate exons; arrowheads indicate location and orientation of primers that were used for RT-PCR and sequencing. B, Agarose gel electrophoresis of products obtained by RT-PCR with primers c438se and c1487as followed by PCR with primers c438se and c879as. “C” denotes normal control; “Ø” denotes a negative control. The DNA standard used was pUC19/MspI. C, Result of sequence analysis of the smaller products from M12487 V-1 and G162 V-7. The first premature termination codon is created 23 bp downstream from the exons 5–7 junction and is indicated by an asterisk (*). D, Results of quantitative analysis of fluorescent RT-PCR products obtained with primers c438se and c879as. Boxed numeric values below peaks are the peak integrals as determined by the Genotyper software; the ratio of individual peak integrals to the grand total is shown to the right of each peak. E, Graph with summary of results of fluorescent RT-PCR. Each circle indicates the ratio of the mutant peak integral to the grand total and represents the result of a single RT-PCR; vertical bars indicate the arithmetic means.

