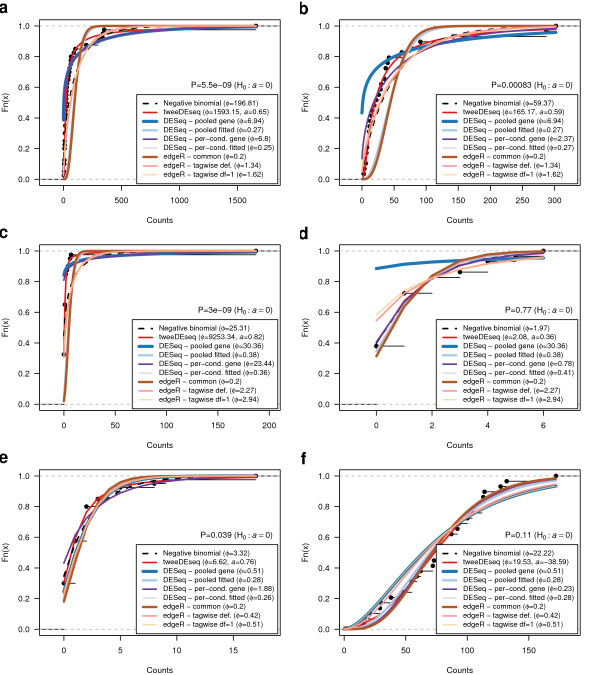
Figure 1.
Fit of different count data distributions to diverse RNA-seq gene expression profiles. Fit of different count data distributions to the female (a, c, e) and male (b, d, f) RNA-seq expression profiles of genes EEF1A2(a, b), SCT(c, d) and NLGN4Y(e, f). All plots show the empirical cumulative distribution function (CDF) of counts (black dots) and the CDF estimated by a pure negative binomial model (black dashed line), a Poisson-Tweedie model (red line) obtained with tweeDEseq and several moderated negative binomial models obtained with different parameter configurations of DESeq and edgeR. Estimated dispersions, and shape in the case of tweeDEseq, are indicated in the legend. Above the legend, the P-value of the test of goodness-of-fit to a negative binomial distribution is shown. According to this test, expression profiles in panels (a, b, c and e) do not follow a negative binomial distribution. Female samples display non-negative binomial features such as a heavy-tail (a, c) and zero-inflation (c, e). Gene NLGN4Y is documented in the literature as a gene with sex-specific expression, while the other two are not (EEF1A2 is a housekeeping gene and SCT is an endocrine hormone peptide in chromosome 11 that controls secretions in the duodenum).

