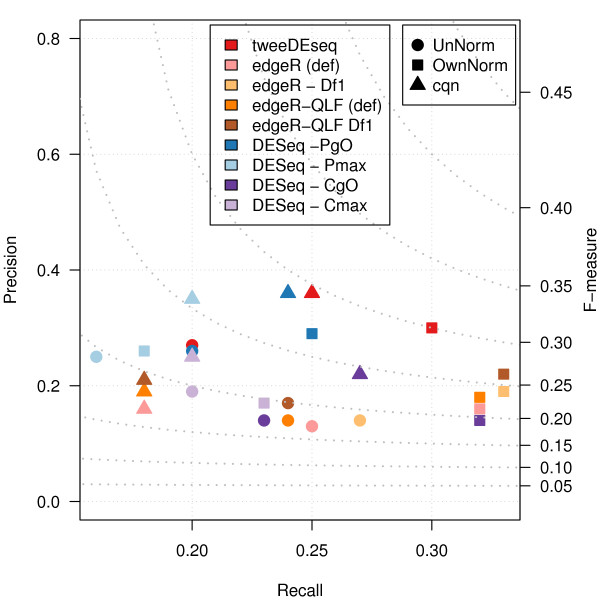
Figure 10.
Precision and recall comparison on the LCL RNA-seq data. Precision (y-axis) and recall (x-axis) values for genes called DE at 1% FDR by different DE detection methods and configuration parameters. The right y-axis indicates values of the F-measure shown by dot lines. As the figure shows, tweeDEseq provides higher F-measure values than other methods indicating a better precision-recall tradeoff.

