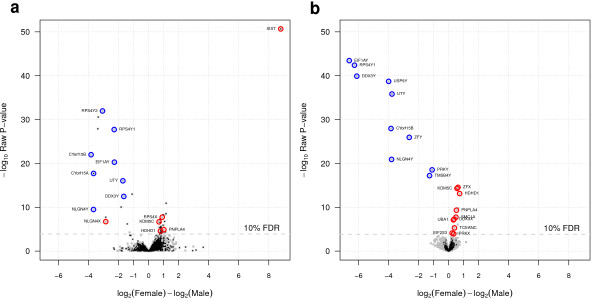
Figure 12.

Comparison of DE analyses between microarray and RNA-seq. Volcano plots of DE analyses performed on matching LCL samples profiled with RNA-seq (a) and gene expression microarrays (b). The x-axis corresponds to log2 fold-changes between female and male individuals while the y-axis corresponds to − log10p-value of significance. RNA-seq data were analysed with tweeDEseq while microarray data were analysed with limma. Grey dots indicate genes common to both, the RNA-seq and the microarray gene expression matrices, while black dots indicate genes occurring exclusively in one of the two data sets. Blue and red circles indicate genes documented in the literature with sex-specific expression, concretely belonging to the male-specific region of chromosome Y and escaping X-chromosome inactivation in females, respectively.
