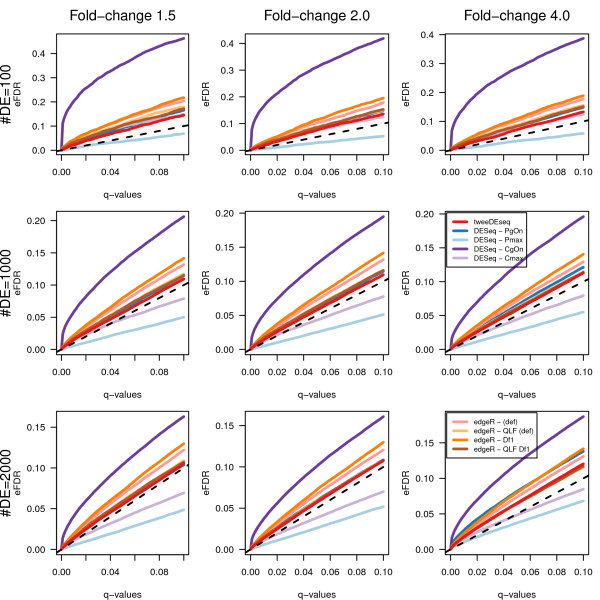
Figure 8.
Empirical FDR values for simulated data with variable library factors. Empirical FDR values on the y-axis as function of nominal q-values on the x-axis calculated from data simulated with p=20,000 genes, n=70 samples and variable library factors. Each row and column corresponds, respectively, to a different number of DE genes and magnitude of the fold-change. The method introduced in this paper, tweeDEseq, is consistently closer to the diagonal than other methods throughout the different simulations.

