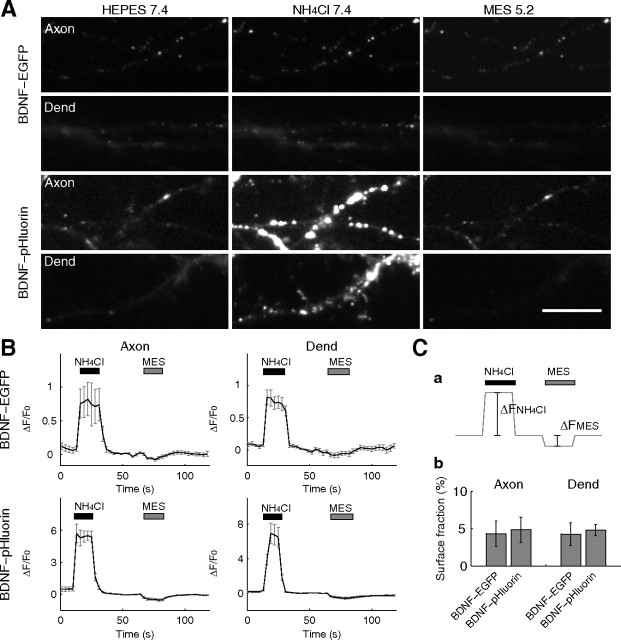
Figure 3.
NH4Cl and acid perfusion of neurons expressing BDNF–EGFP/pHluorin. A, Representative images of the axon and dendrite (Dend) of neurons expressing either BDNF–EGFP or BDNF–pHluorin, after the perfusion of various solutions. Scale bar, 10 μm. B, Time course of the fluorescence changes of BDNF–EGFP or BDNF–pHluorin, averaged over 50 puncta in single neurons, induced by the perfusion with NH4Cl (pH 7.4) or MES-buffered acidic solution (pH 5.2). C, a, Schematic diagram depicting the measured quantities (ΔFNH4Cl and ΔFMES) in perfusion-induced changes in the pHluorin fluorescence. Because pHluorin is completely quenched at pH 5.2 (Sankaranarayanan et al., 2000), ΔFNH4Cl represents the total amount of BDNF–pHluorin in the vesicular compartment that was unquenched by perfusion with NH4Cl. ΔFMES represents the quenched surface fraction (fsur) of BDNF–pHluorin by perfusion with MES-buffered acidic solution (pH 5.2). The surface fraction thus can be calculated as fsur = ΔFMES/(ΔFNH4Cl + ΔFMES). b, Bar graph showing the calculated fraction (mean ± SEM) for BDNF–EGFP and BDNF–pHluorin on the cell surface, from measurements of ΔFNH4Cl and ΔFMES.

