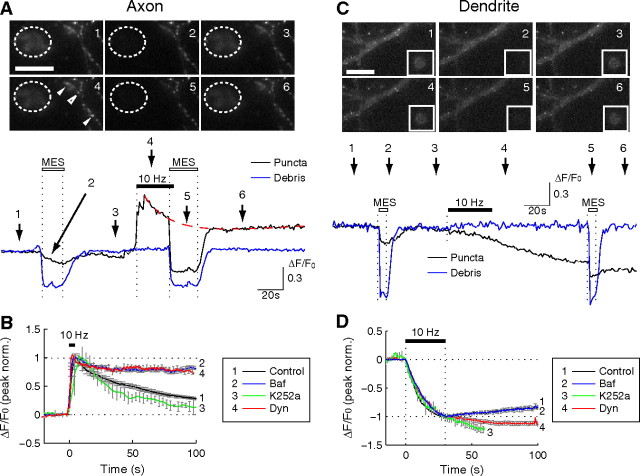
Figure 4.
Partial versus full fusion of BDNF–pHluorin vesicles at axon and dendrite. A, C, Wide-field fluorescence images of an axon expressing BDNF–pHluorin and fluorescent debris from a broken cell nearby (dashed circle, A) or in the same field of view (box, C). Trace below, BDNF–pHluorin puncta fluorescence changes with time (normalized by the basal fluorescence) at a single axon (black) and at a piece of cell debris (blue), before and after field stimulation (10 Hz, 300 pulses) or in response to extracellular perfusion with an MES-buffered acidic solution (pH 5.2; open bars). Numbers refers to the time the images above were collected. B, D, The average trace of the changes in pHluorin fluorescence after field stimulation at time marked as “10 Hz”, showing the sensitivity of the fluorescence decay at the axon (B) or of the tail of fluorescence reduction at the dendrite when the cultures were treated with bafilomycin-A1 (Baf), dynasore (Dyn), and K252a. Dynasore and K252a applied 20 min before and bafilomycin applied immediately before stimulation. Error bars indicate SEM.

