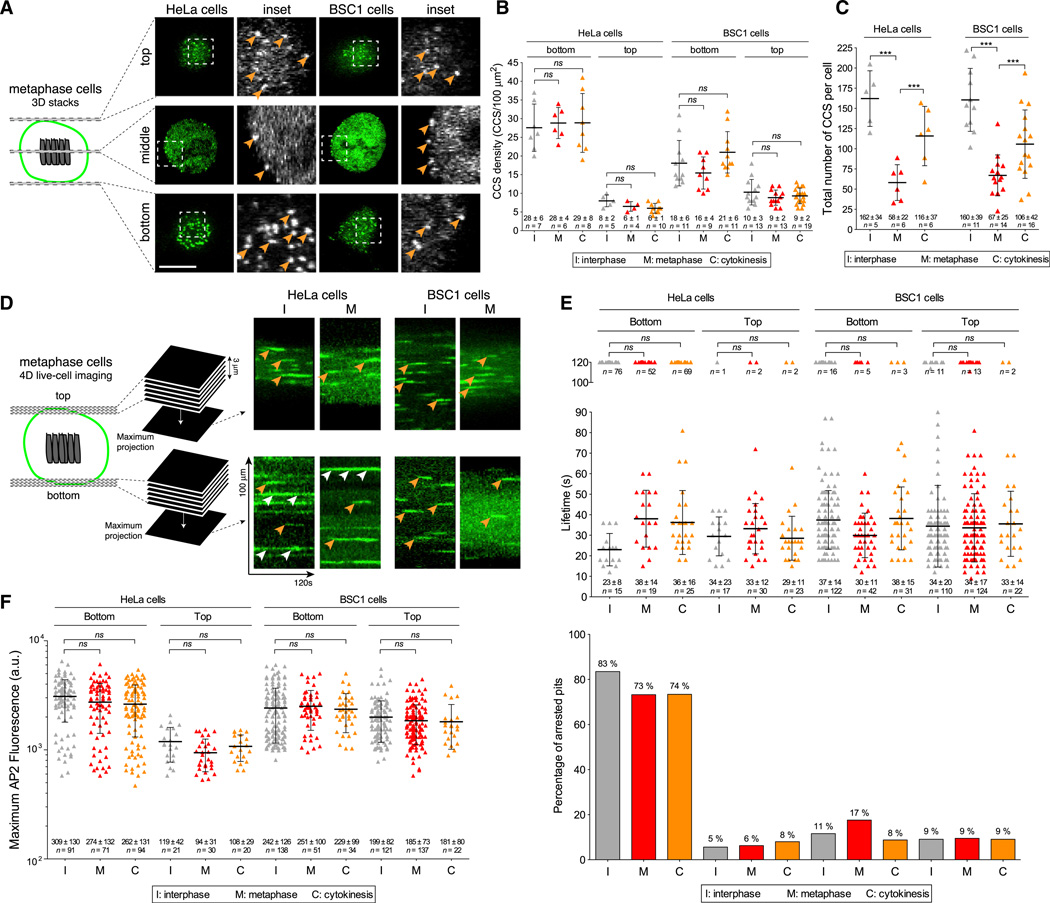
Figure 1. Coat Dynamics Are Not Affected during Natural Mitosis.
(A) Schematic representation of the 3D visualization strategy used to image metaphase cells, and visualization examples showing AP2 spots corresponding to endocytic clathrin/AP2-coated pits and vesicles (arrowheads); z stacks were obtained by imaging sequential planes spaced 0.5 µm apart. The examples correspond to images obtained by spinning-disc confocal fluorescence microscopy from the top and bottom surfaces and the middle equatorial planes of metaphase HeLa and BSC1 cells stably expressing σ2-EGFP. The scale bar represents 10 µm.
(B) Surface density of clathrin/AP2-coated structures (CCS/100 µm2) calculated from the number of AP2 spots at the top and bottom surfaces of HeLa and BSC1 cells imaged during interphase, metaphase, and cytokinesis prior to abscission. Bars and numerical values are averages ± SD; n, number of cells; ns, no statistical difference (p > 0.05).
(C) Total number of clathrin/AP2-coated structures (CCS per cell) on the plasma membrane of a cell as determined by counting the number of fluorescent AP2 spots detected in each whole z stack obtained by 3D live-cell imaging. Bars and numerical values are averages ± SD; n, number of cells; ***p < 0.0001.
(D) Schematic representation of the 4D visualization strategy. The examples are kymograph representations obtained from 2D time series corresponding to maximum-intensity z-projection sets from 4D time series acquired using spinning-disc confocal microscopy. The examples illustrate the temporal behavior of AP2 spots at the top and bottom surfaces of HeLa and BSC1 cells stably expressing σ2-EGFP. Orange and white arrowheads highlight canonical coated pits and plaques, respectively.
(E) Upper panel: plot of the individual lifetimes of clathrin/AP2 pits from HeLa and BSC1 cells calculated from 4D time series obtained from the bottom and top surfaces during metaphase and cytokinesis, or from 2D and 4D time series from the bottom and top surfaces of interphase cells. At least five cells were imaged for each condition. Bars and numerical values are averages ± SD; n, number of AP2 spots. Lower panel: fraction of AP2 spots (percentage of arrested pits) whose lifetime was longer than the time series (120 s) corresponding to the data in the upper panel.
(F) Plot of individual maximum fluorescence signals of AP2 spots obtained from the time series used to calculate the data in (E).

