
Figure 1. Single agent IC50 of Olaparib.
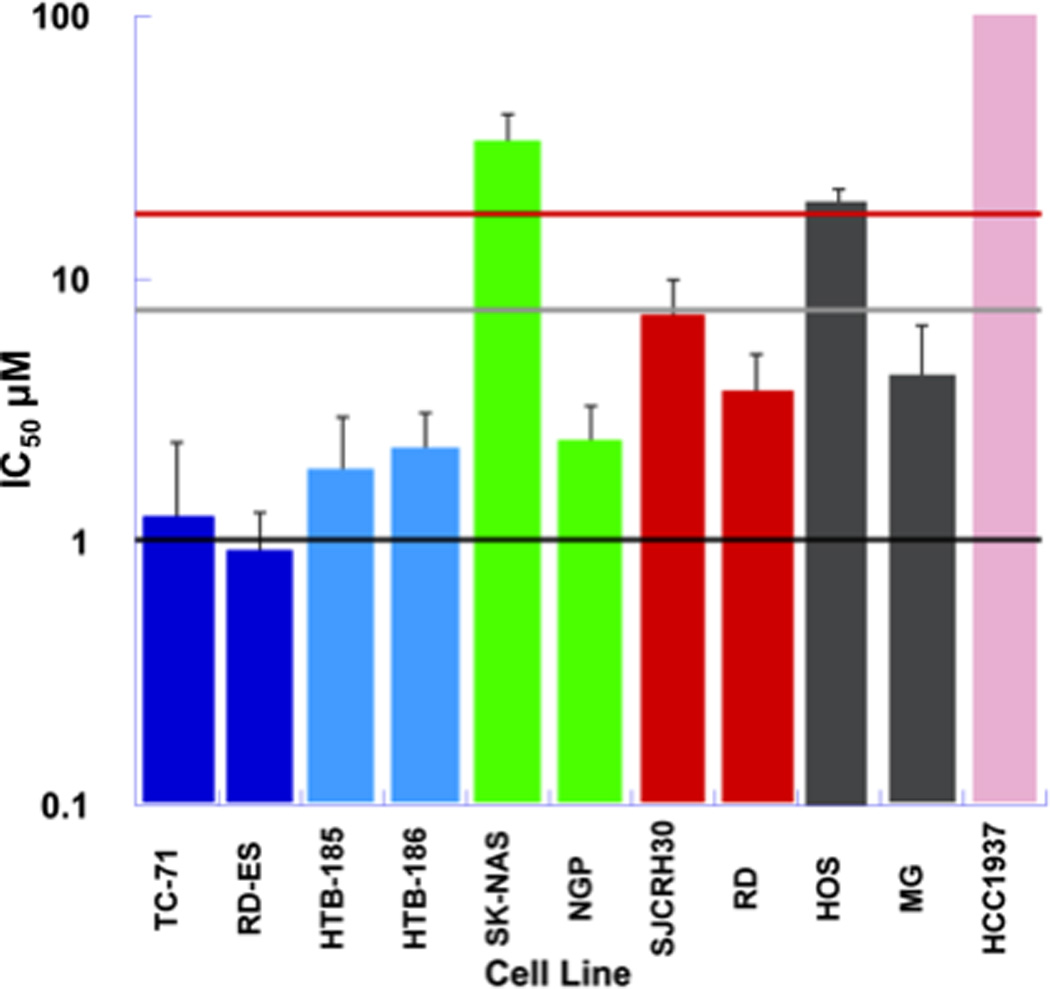
Single agent IC50 of olaparib in a solid tumor cell line panel consisting of Ewing sarcoma (blue), medulloblastoma (light blue), neuroblastoma (green), rhabdomyosarcoma (red), osteosarcoma (grey), and BRCA1 deficient (pink) cell lines. Plasma concentrations achieved in adults receiving olaparib (100 mg BID) are represented by the black line (Cmin=1µM) and light grey line (Cmax = 8.5 µM). The red horizontal line represents the plasma concentration (Cmax =18 µM) associated with maximum tolerated dose (400mg BID) of olaparib when given as a single agent[28].