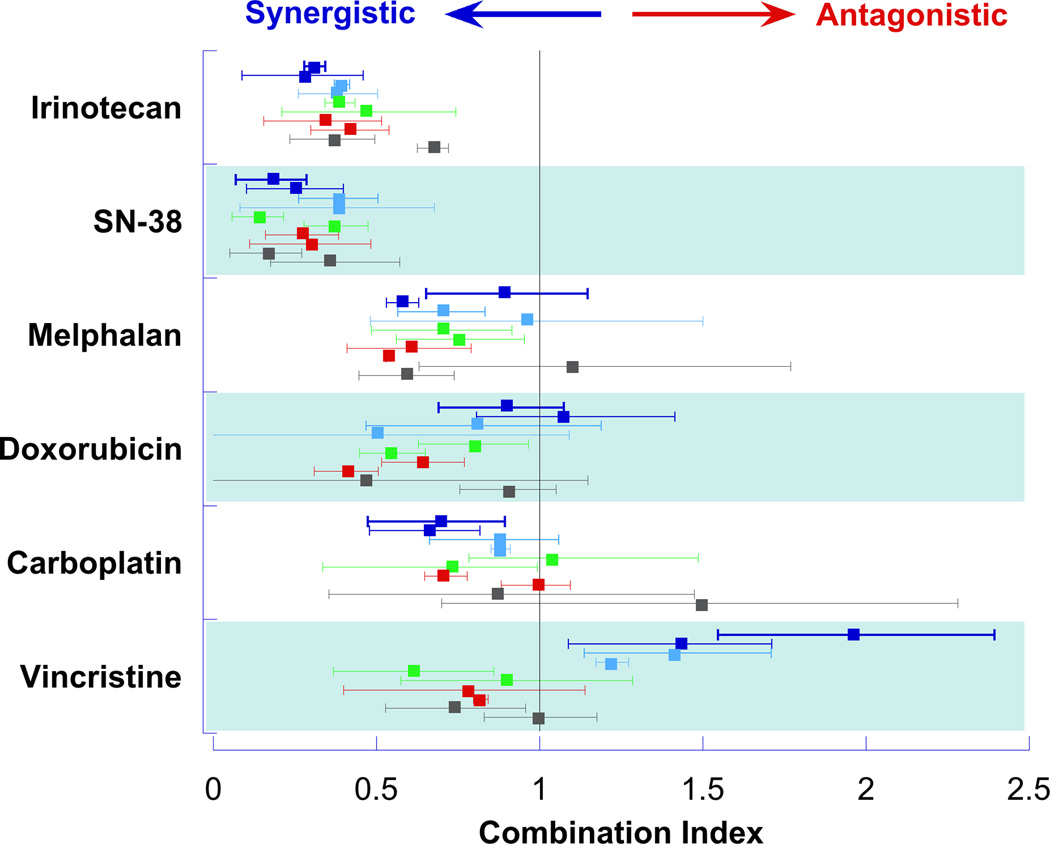
Figure 2. Interaction of Olaparib and Cytotoxic Agents.
The combination index (symbol) with 95% confidence interval (line) for olaparib in combination with each cytotoxic agent is presented for each cell line. Ewing Sarcoma lines (TC-71 and RD-ES) represented in dark blue, medulloblastoma lines (HTB-185 and HTB-186) represented in light blue, neuroblastoma lines (SK-NAS and NGP) represented in green, rhabdomyosarcoma lines (SJCRH-30 and RD) represented in red, and osteosarcoma lines (HOS and MG-63) represented in grey.

