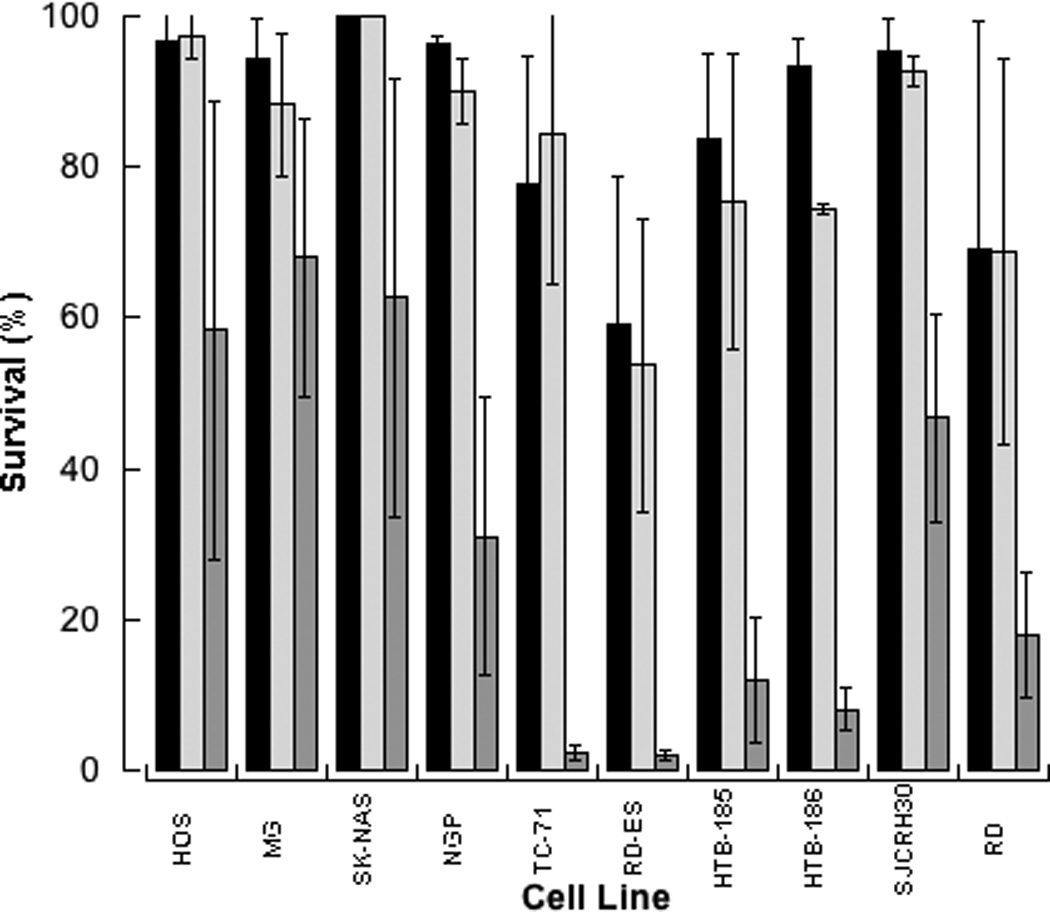
Figure 3. Interaction of Olaparib and SN-38.

Growth inhibition (mean, SD) following exposure to 1µM olaparib (light grey), cell line specific concentration of SN-38 (black), or concomitant exposure to both agents (dark grey). Concentrations of SN-38, determined by the IC50 ratio of SN38 to olaparib, ranged from 0.00013 to 0.0033 µM and were the same in single agent and combination data presented.
