
Figure 4. Responses of xenografts to topotecan and cyclophosphamide in combination with olaparib. A, Neuroblastoma xenograft (NGP). B, Ewing sarcoma xenograft (ES).
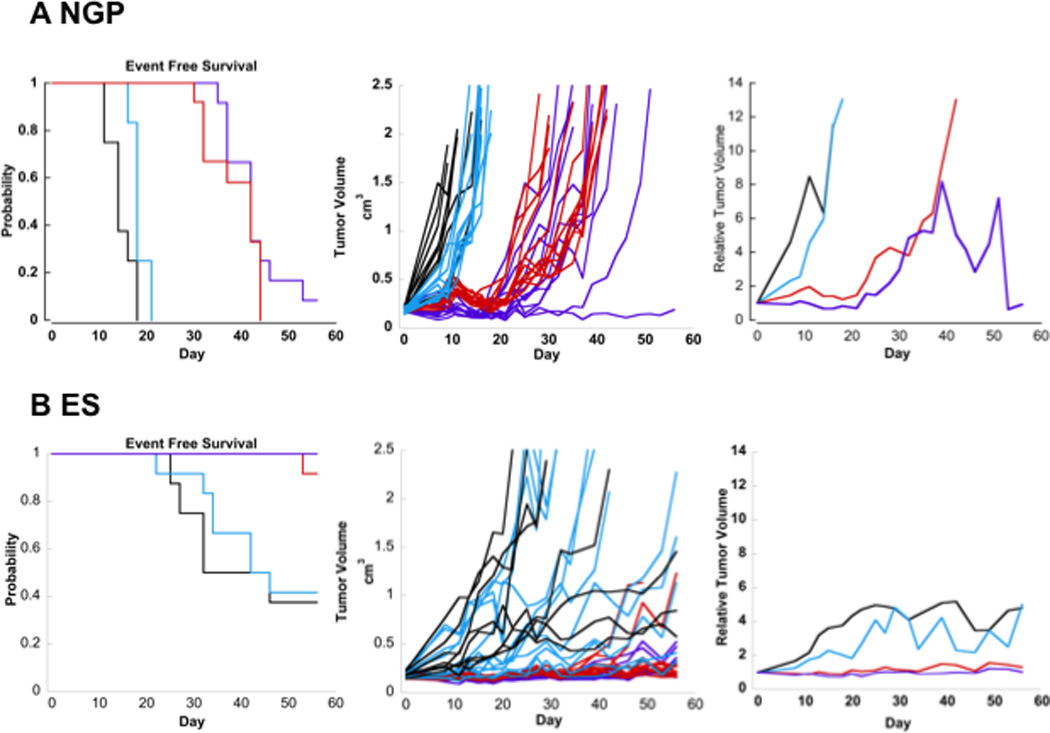
Event-free survival curves (left), individual tumor volume graphs (middle), and median relative tumor volume graphs (right) are shown for tumor xenografts. Tumor bearing mice were treated with a) vehicle control (black), b) olaparib (aqua) (20mg/kg daily ×5 days), c) topotecan (0.5mg/kg daily ×5 days) and cyclophosphamide (10mg/kg daily ×5 days) (red), or d) the combination of topotecan (0.5mg/kg daily ×5 days), cyclophosphamide (10mg/kg daily ×5 days), and olaparib (20mg/kg daily ×5 days) (purple).