Figure 2.
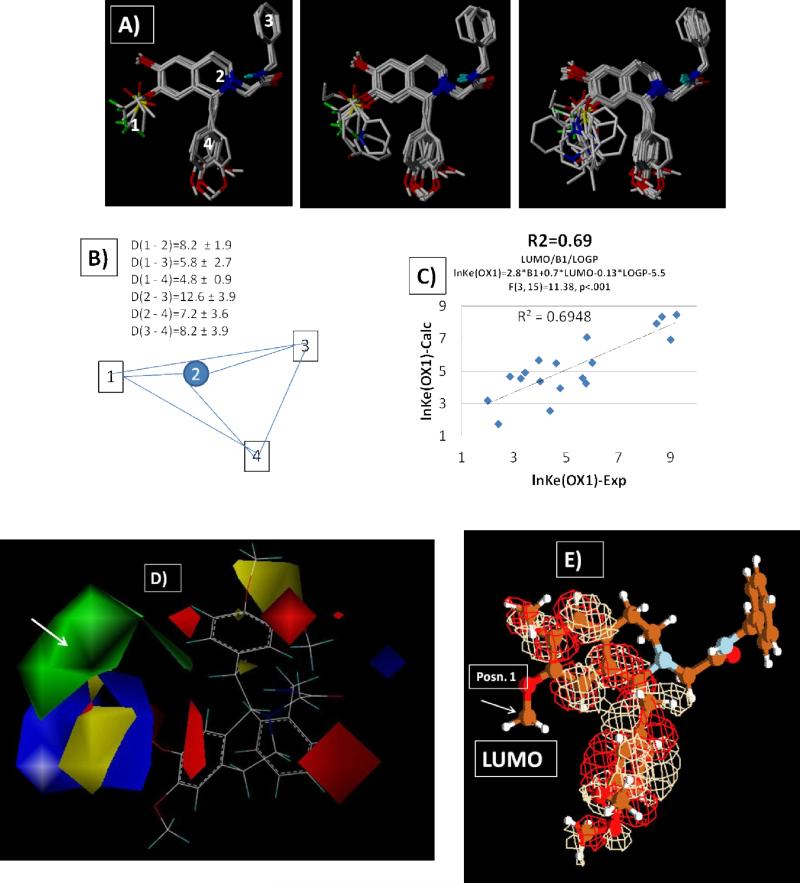
A) Ligands superimposed at 3D-pharmacophore points defined by B) the abstract pharmacophore representation computed from 21 ligands in Table 1. C) a plot of the predicted lnKe(OX1) vs. experimental for a fragment (2D) QSAR illustrating that contributions from the width (Verloop Sterimol “B1”), polar surface area, ClogP and lowest unoccupied (LUMO) energy of the substituent give a robust analysis (r2=0.7/F=8.2 (n1=4,n2=18), p=0.001/ 2.8B1+0.7*E(LUMO)-0.13logP-5.5)). D) 3D-COMFA/QSAR illustration of the increased steric bulk contributions region of the substituent variation highlighted by green correlate with low Ke values with minor modulation due to electrostatic contributions. E) a depiction of the location of the LUMO density on compound 6.

