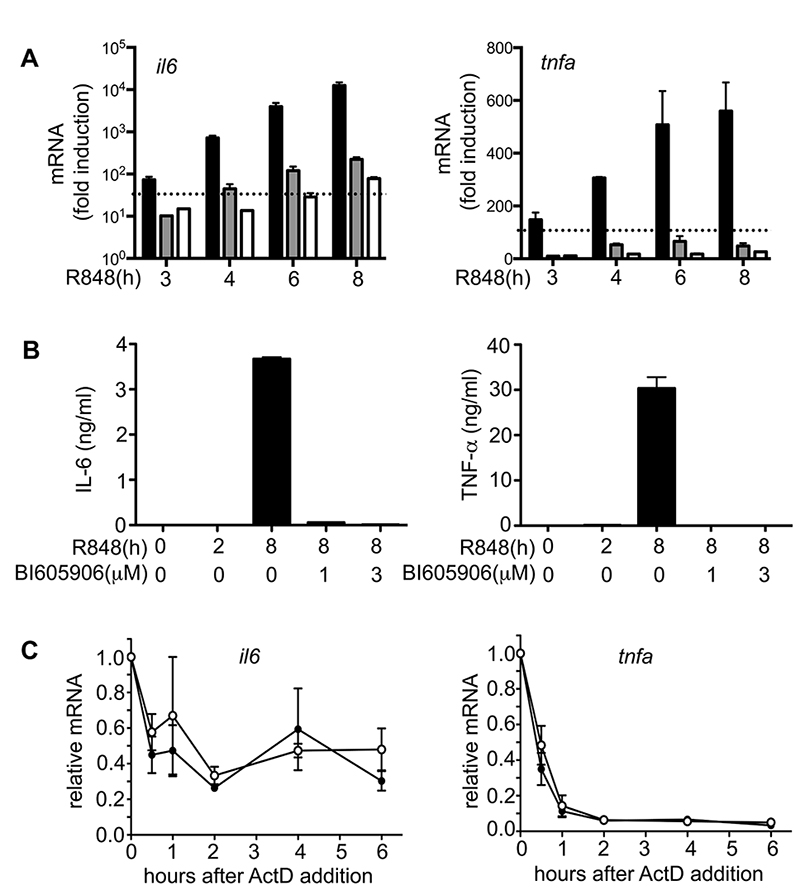
Figure 4. Inhibition of IKKβ leads to suppression of pro-inflammatory cytokine production.
(A) BMDMs from WT mice were stimulated for 2 h with 1.0 μg/ml R848. The IKKβ inhibitor BI605906 was then added to the culture medium to a concentration of 1.0 μM (grey bars) or 3.0 μM (white bars). The black bars show a control experiment in which no inhibitor was added after 2 h. RNA was extracted from the cells at each time point, and il6 and tnfa mRNA was measured by quantitative real-time PCR. Results are plotted as the fold increase in mRNA relative to the level determined in unstimulated cells, and the broken line indicates the amount of mRNA produced after 2 h before the addition of BI605906. Error bars show the average of duplicate determinations for each condition. Data shown are representative of two independent experiments. (B) Cell culture supernatants from (A) were collected and the concentrations of IL-6 and TNF-α were measured. (C) BMDM from either WT (○) or IRAK2[E525A] mice (●) were stimulated for 1.5 h with 1.0 μg/ml R848 and actinomycin D (ActD) was added to the culture medium to a final concentration of 5 μg/ml. Stimulation with R848 was continued and RNA was extracted from the cells at the times indicated and il6 (left panel) and tnfa (right panel) mRNA was measured by qPCR. The ordinate shows the mRNA levels at each time point relative that measured at the time of ActD addition (1.0). Error bars represent the mean ± SEM for experiments with BMDM from three mice of each genotype. Data shown are representative of two independent experiments.

