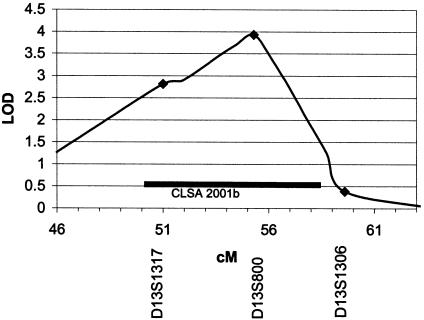
Figure 2.
Four-point analysis of the recessive reading model using markers D13S1317, D13S800, and D13S1306. This graph shows the overlap between our observed linkage and the CLSA (2001b; originally published as Bradford et al. 2001). The horizontal bar indicates the Zmax-1 interval from the CLSA data set.

