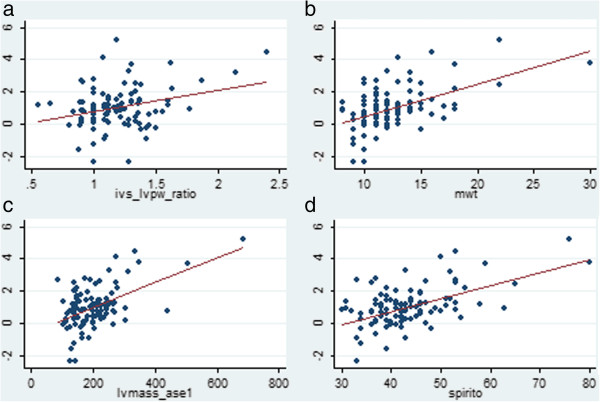
Figure 2.

Scatterplot with fitted linear regression line, showing the association between the natural log of highly sensitive cardiac troonin I with a. the IVS:LVPW ratio, b. the MWT, c. the LV mass estimate and d. the Spirito index. Footnote for Figure 2: Regression coefficient for the IVSd: LVPWd ratio was 0.008, 95% CI [0.52, 2.19], p=0.002, adjusted R2 0.08. Regression coefficient for the LV maximal wall thickness was 0.20, 95% CI [0.13, 0.26], p<0.0005, adjusted R2 0.25. Regression coefficient for the LV mass was 0.088, 95% CI [0.005, 0.010], p<0.0005, adjusted R2 0.26. Regression coefficient for the Spirito score was 0.08, 95% CI [0.06, 0.10], p<0.0005, adjusted R2 0.29.
