Figure 4.
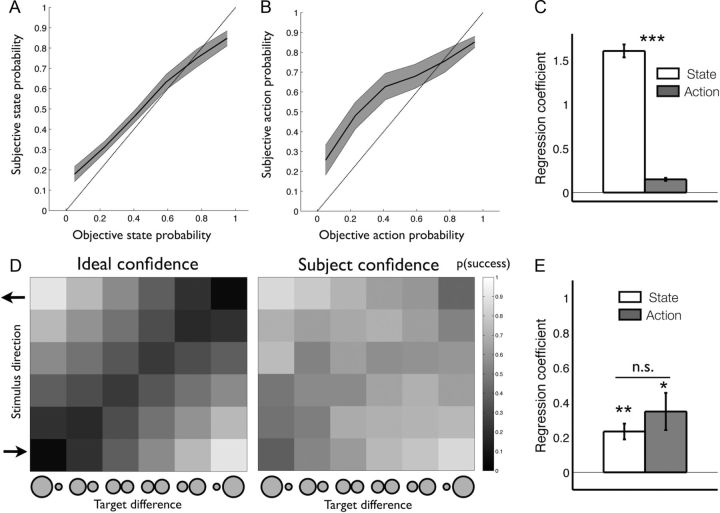
Experiment 2 results. A, Average subjective state probability in Experiment 2 plotted against objective state probabilities derived from the calibration stage. B, Average subjective probability of hitting chosen targets in Experiment 2 plotted against objective action probabilities derived from the calibration stage. C, State and action regression coefficients from a probit analysis of Experiment 1 (pooling over visual and auditory experiments), but now assuming the probability weighting functions derived from Experiment 2 (A, B). D, Ideal observer model of confidence (probability of success) and average subject data from Experiment 2. Colors reflect the predicted confidence rating as a function of both stimulus coherence (y-axis) and target asymmetry (x-axis). E, Regression coefficients for the influence of state and action probabilities on confidence judgments (Experiment 2). n.s., not significant; *p < 0.01; **p < 0.001; ***p < 0.0001; error bars reflect SEM.

