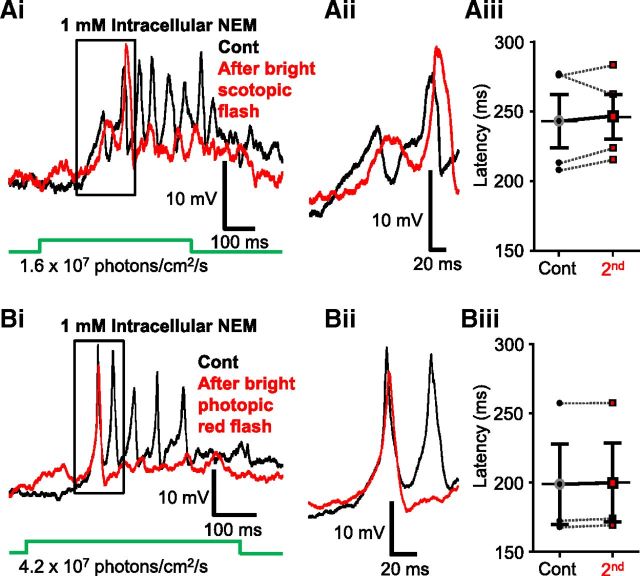
Figure 10.
Both bright scotopic and photopic light induced modulation of scotopic light responses in Mb terminals in an NEM-sensitive manner. Ai, Including NEM (1 mm) in the pipette solution prevented bright scotopic light stimulation (500 ms, λ = 505 nm, 2.4 × 10⁸ photons/cm2/s) from reducing the latency of dim scotopic green light (500 ms, λ = 505 nm, 1.6 × 10⁷ photons/cm2/s) responses of Mb terminals. Membrane potentials at the beginning of traces shown in Ai are −48.7 mV (black) and −48.4 mV (red). Aii, Enlargement of boxed area in Ai illustrating that the delay of dim scotopic green light-induced Ca2+ spikes, after the bright scotopic green stimulation, remained similar to that of control in the presence of NEM. Membrane potentials at the beginning of traces are −49.5 mV (black) and −47.6 mV (red). Aiii, Pairwise comparison showing no significant difference in latency of scotopic light responses (500 ms, λ = 505 nm, 1.6 × 10⁷ photons/cm2/s) compared before and 5 min after bright scotopic green flash (500 ms, λ = 505 nm, 2.4 × 10⁸ photons/cm2/s) in the presence of NEM. Black circles represent control; red squares represent second scotopic response latency; n = 4. Bi, When NEM (1 mm) was included in the pipette solution the bright red flash (500 ms, 660 nm, 5 × 10¹³ photons/cm2/s) did not induce a leftward shift in the latency to first spike triggered by scotopic green stimulation (505 nm, 4.2 × 10⁷ photons/cm2/s). Membrane potential at the beginning of both traces shown in Bi is −52 mV. Bii, Enlargement of boxed area in Bi illustrating that the delay of scotopic green light-induced Ca2+ spikes, after the bright red stimulation, remained similar to that of control in the presence of NEM. Membrane potentials at the beginning of traces are −48 mV (red) and −50 mV (black). Biii, Pairwise comparison showing no significant difference in latency of scotopic light responses (505 nm, 4.2 × 10⁷ photons/cm2/s) compared before and 5 min after bright red flash in the presence of NEM. Black circles represent control; red squares represent second scotopic response latency; n = 3. Data are mean ± SEM.

