Figure 8.

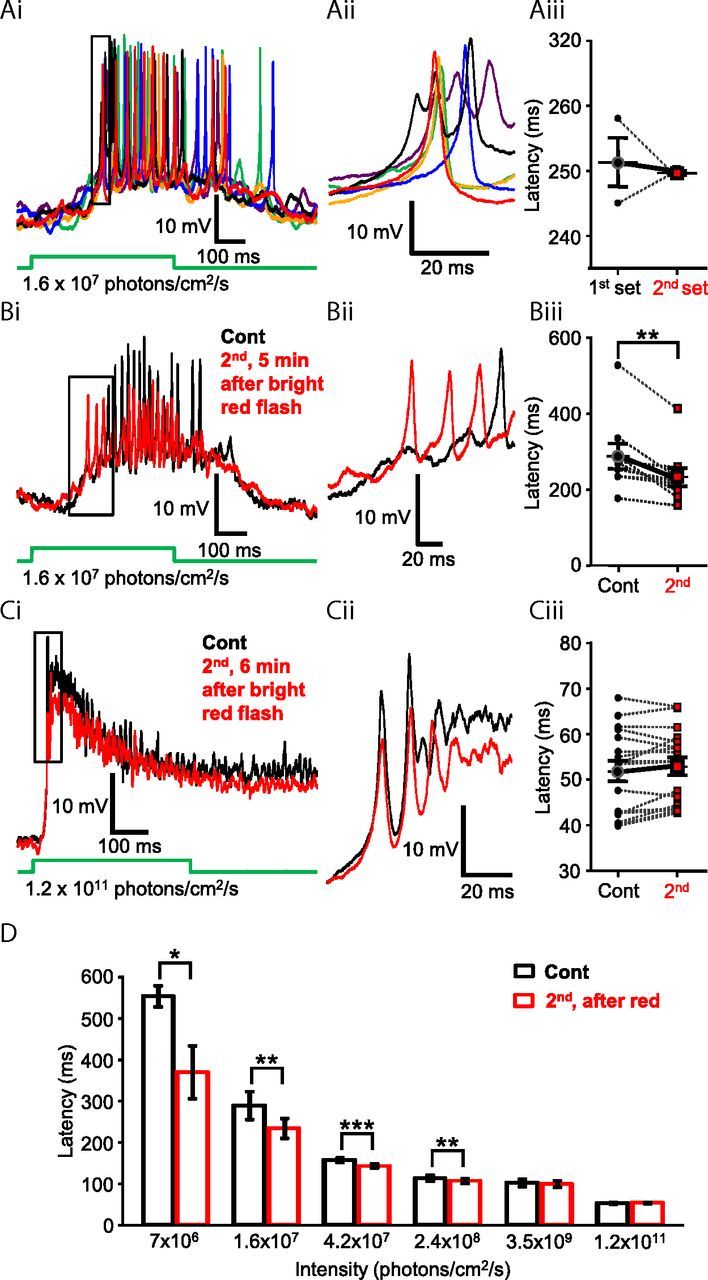
Photopic light stimulation modulated scotopic light responses of Mb axon terminals. Ai, Repeated stimulations of rod-specific scotopic green light flashes (500 ms, λ = 505 nm, 1.6 × 10⁷ photons/cm2/s) did not significantly alter the latency of evoked Ca2+ spikes from the axon terminal of an intact Mb. The first set of responses (black, blue, and green traces) were evoked by three distinct flashes of dim green light with a 5 s delay between flashes. After a 4 min delay, a second set of responses (purple, red, and orange traces) was evoked by three distinct flashes of dim green light. Membrane potentials at the beginning of the traces are −51.8 mV (black), −48.9 mV (blue), −52.4 mV (green), −47.9 mV (purple), −50.8 mV (red), and −52.1 mV (orange). Aii, Enlargement of boxed area in Ai illustrating consistency in the latency of scotopic green light-induced Ca2+ spikes. Membrane potentials at the beginning of the traces are −44.6 mV (black), −44.7 mV (blue), −43.3 mV (green), −41.9 mV (purple), −44.6 mV (red), and −46.6 mV (orange). Aiii, Summary graph showing paired comparison of latency to first spikes of corresponding responses triggered by the first and second set of dim green (505 nm, 1.6 × 10⁷ photons/cm2/s) light flashes. The latency to first spike was not significantly different between sets. Black circles represent first set; red squares represent second set. Bi, Rod-mediated scotopic green (505 nm, 1.6 × 10⁷ photons/cm2/s) full-field light flash (500 ms) evoked responses recorded from the axon terminal of an intact Mb, in dark-adapted retina slice preparation (black), were modulated by bright red light stimulation (500 ms, 660 nm, 5 × 10¹³ photons/cm2/s, Mb response not shown here; but see Fig. 9Ci). Five minutes after the bright red flash, the repeated dim green stimulus evoked spiking response with decreased latency (red trace) compared with control. Membrane potential at the beginning of both traces was −51 mV. Bii, Enlargement of boxed area in Bi illustrating the decreased latency of scotopic green light-induced Ca2+ spikes, after the bright red stimulation. Membrane potentials at the beginning of traces are −50.5 mV (red) and −52.8 mV (black). Biii, Summary graph showing paired comparison of latency to first spike triggered by dim green (505 nm, 1.6 × 10⁷ photons/cm2/s) flash before and after presentation of bright red light recorded from different Mb terminals. The latency to first spike was significantly reduced for the second stimulus, on average by 55.18 ± 14.98 ms. Black circles represent control; red squares represent second scotopic response latency. **p = 0.006 (paired Student's t test). n = 9. Ci, Responses of Mb terminal to mesopic green (500 ms, 505 nm, 1.2 × 10¹¹ photons/cm2/s) light flashes, before (black) and 5 min after (red) the bright red flash (660 nm, 5 × 10¹³ photons/cm2/s, 500 ms, Mb response not shown). No difference in the delay of mesopic light responses was noticeable. Membrane potential at the beginning of the traces was −52 mV. Cii, Enlargement of boxed area in Ci illustrating no apparent difference in the latency of scotopic green light-induced Ca2+ spikes, after the bright red stimulation. Membrane potentials at the beginning of traces are −50.25 mV (red) and −50.1 mV (black). Ciii, Summary graph of paired comparison of mesopic green light (500 ms, 505 nm, 1.2 × 10¹¹ photons/cm2/s) response latency before and after presentation of bright red light. No significant difference was detected. Black circles represent control; red squares represent second scotopic response latency. n = 17. D, Summary graph showing the average latency to first spike from green light responses triggered by six intensities before (black) and 5 min after (red) bright red stimulation. Of the six different intensities of green light presented, a significant decrease in latency was observed in response to dim, scotopic intensities known to stimulate rods, but not cones (≤3.5 × 10⁹ photons/cm2/s): 7 × 10⁶ photons/cm2/s; n = 3. *p = 0.04. 1.6 × 10⁷ photons/cm2/s; n = 9. **p = 0.006. 4.2 × 10⁷ photons/cm2/s; n = 17. ***p = 0.0001. 2.4 × 10⁸ photons/cm2/s; n = 17. **p = 0.02. 3.5 × 10⁹ photons/cm2/s; n = 17. 1.2 × 10¹¹ photons/cm2/s: n = 17 (paired Student's t test). Data are mean ± SEM.
