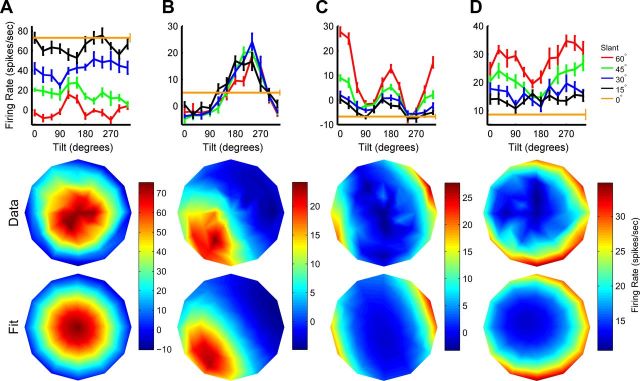
Figure 4.
Slant–tilt tuning curves of four CIP neurons. A–D, Tilt tuning curves measured at different slants are plotted along with the joint slant-tilt tuning curve (as in Fig. 2C) and Bingham function fit (as in the right column of Fig. 3B). Responses are baseline subtracted, error bars on the tilt tuning curves are SEM, and firing rate is color coded in the joint tuning curves. Parameter fits are provided for comparison with the population histograms (Figs. 6, 7). A, Cell preferring small slants (near frontoparallel planes). Fit parameters: s = 2°, t = 221°, λ1 = −0.21, λ2 = 1.30, and φ = 103°. B, Cell preferring planar surfaces with the lower left side closest to the monkey. Fit parameters: s = 39°, t = 231°, λ1 = −1.34, λ2 = 1.37, and φ = 63°. C, Cell preferring large slants with narrow tilt tuning. Fit parameters: s = 87°, t = 19°, λ1 = −0.34, λ2 = 1.21, and φ = 102°. The appearance of two peaks reflects the cell's large slant preference, and that points on opposite sides of the disc correspond to similar orientations (see Materials and Methods). D, Cell preferring large slants with broad tilt tuning. Fit parameters: s = 86°, t = 261°, λ1 = −1.35, λ2 = 0.40, and φ = 100°.

