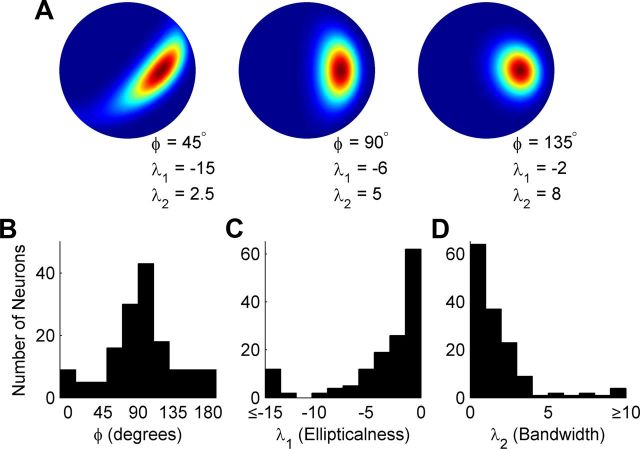
Figure 7.
Population histograms of additional Bingham function tuning parameters. A, Three examples illustrating how the φ, λ1, and λ2 parameters affect the shape of the Bingham function (plotted on the slant-tilt disc as in the right column of Fig. 3B). B, Population histogram for the φ parameter that rotates the tuning curve about the preferred slant-tilt. The peak at 90° indicates that the intermediate and minor axes of most tuning curves were aligned with the azimuth (tilt axis) and elevation (slant axis) of the sphere, respectively (see Fig. 3). Variation in tuning bandwidth thus tended to occur across the tilt and slant (as opposed to oblique) axes. C, Population histogram of the λ1 parameter that sets the aspect ratio of the tuning curve, determining its “ellipticalness.” This parameter allows tuning to be broader along one axis (e.g., tilt) than the other (e.g., slant). The greater the magnitude, the more elongated the tuning curve. D, Population histogram of the λ2 parameter, which determines the tuning bandwidth. Smaller values result in broader tuning.

