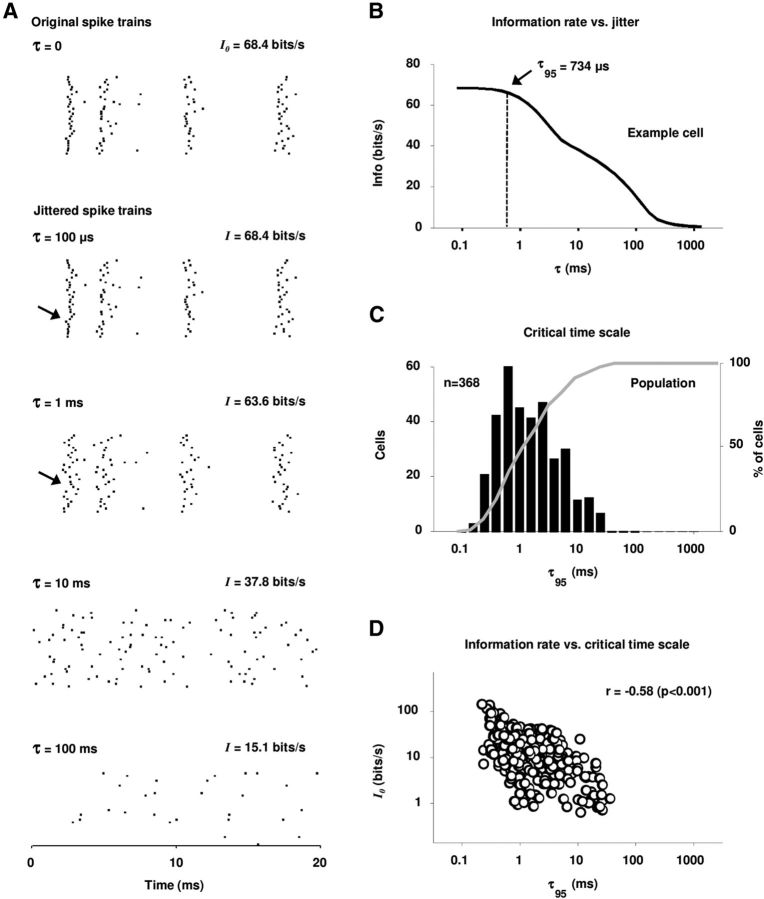
Figure 2.
The temporal precision of IC spike trains. A, Raster plots of the responses of an example IC cell to a 20 ms segment of speech. The top row shows the actual responses and the bottom rows show the responses after the addition of different amounts of random jitter to the spike times. For each response, the single spike information is shown. B, The single spike information for the example cell as a function of the amount of added jitter. The critical timescale at which the information is decreased to 95% of its original value I0 is marked as τ95. C, The histogram (black) and cumulative distribution function (gray) of the critical timescale τ95 for our sample of IC cells. D, A scatter plot of the single spike information I0 versus the critical time scale τ95 for our sample of IC cells. The correlation coefficient between I0 and τ95 with logarithmic scaling is shown.

