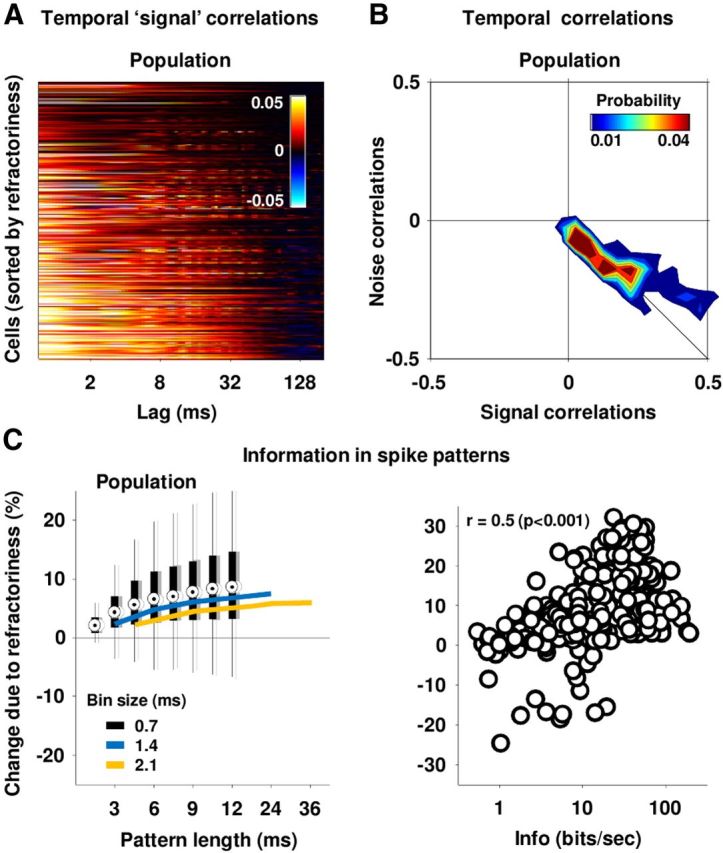
Figure 4.

Refractoriness and information transmission. A, The temporal signal correlation functions for the IC cells in our sample. Cells were ordered for plotting as in 3A. B, The distribution of temporal signal and noise correlations for our sample of cells. To obtain these values, the temporal signal and noise correlation functions for each cell were summed over lags up to 12 ms. C, The black distributions in the left panel show the effects of temporal noise correlations on the information in spike patterns of different lengths with 0.7 ms time bins for our sample of cells. The percentage change in information due to temporal noise correlations was computed as 100 × Icor–ind/(I0 + Isig–sim) (see Materials and Methods for definitions of information theoretic quantities). The gray distributions are those obtained when only half of the trials were used indicating the stability of the result. The blue and orange lines show the median values for the same quantity computed with 1.4 and 2.1 ms bins, respectively. The right panel shows a scatter plot of the effects of temporal noise correlations on the information in spike patterns that were 16 bins long with 0.7 ms bins versus the single spike information for each cell in our sample.
