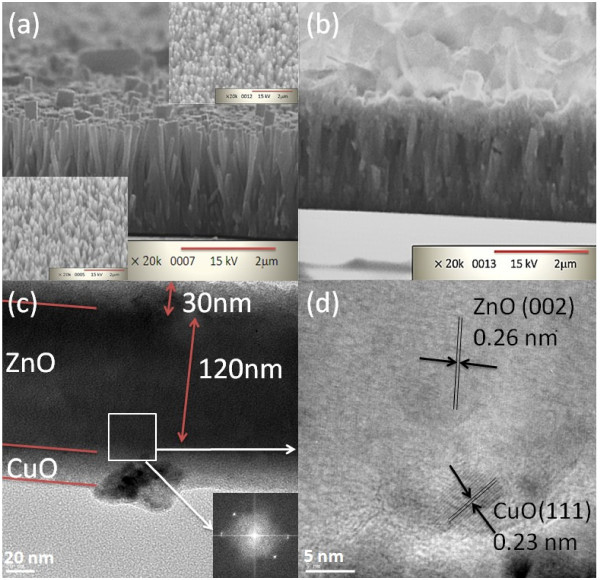
Figure 2.
SEM and TEM images and FFT. SEM images of the cross-sectional view of (a) ZnO NW arrays and (b) ZnO NWs/CuO CH. Bottom-left and top-right insets in (a) show tilt views of ZnO NWs and PR on ZnO NWs, respectively. (c) Low-magnification TEM image and FFT (inset) of ZnO/CuO CH. (d) High-magnification TEM image of the ZnO/CuO interface taken from the square region drawn in Figure 2c.

