Figure 6.
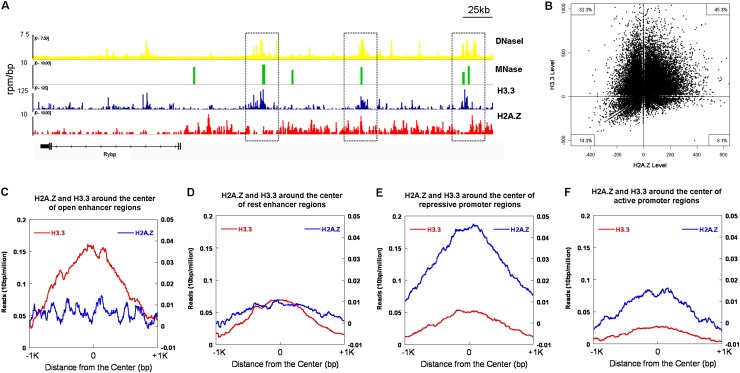
Genome-wide distributions of H2A.Z and H3.3 and their correlation with chromatin structures. (A,B) Correlation of the enrichment of H3.3 and/or H2A.Z with open chromatin regions (MNase-sensitive sites). (A) Genome browser tracks show the correlation of open chromatin regions (DNaseI- and MNase-sensitive sites) with the histone variant H3.3 and H2A.Z occupancy (Goldberg et al. 2010; Xiao et al. 2012). (B) Quantitative analysis of the genome-wide correlation of H3.3 (Y-axis) or H2A.Z (X-axis) with MNase-sensitive regions (total number 34,142). (C,D) The distribution of H2A.Z and H3.3 at the open and rest enhancer regions across the entire genome. H3.3 was highly enriched in the open enhancer regions with very low levels of H2A.Z (C), while there were relatively low levels of H3.3 and H2A.Z localized at the rest enhancer regions (D). (E,F) The distribution of H2A.Z and H3.3 at the repressive and active promoter regions across the entire genome. H2A.Z was highly enriched in the repressive promoter regions with very low levels of H3.3 (E), while both relatively low levels of H2A.Z and H3.3 were observed at the active promoter regions (F).

