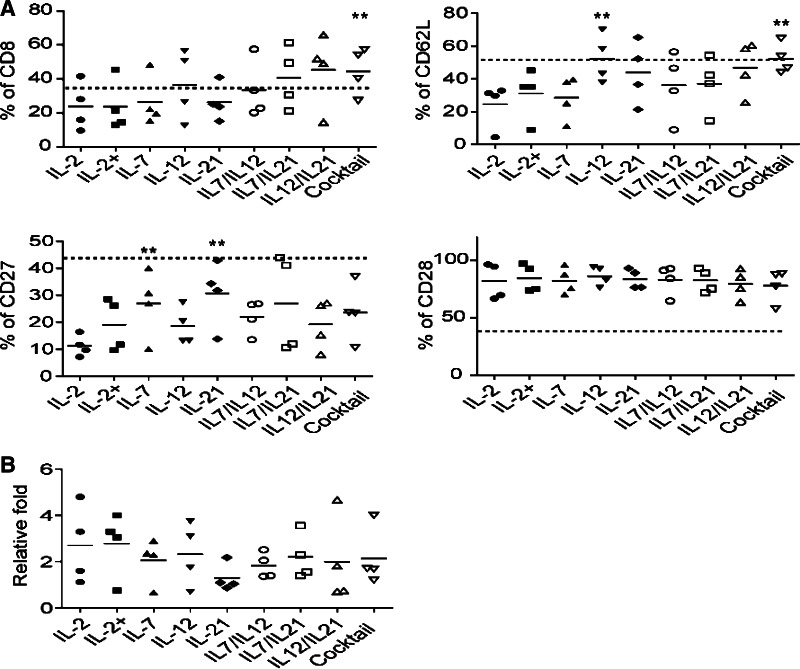
Fig. 2.
The effect of cytokines or their combinations on phenotype and proliferation of ttRNA–DC ex vivo-expanded anti-tumor T cells. a The phenotypic analysis after ex vivo expansion. The data from 4 donors were presented as average ± SD. The dashed lines represent the percentage of each marker at day 1 after overnight recovery using medium without cytokines: 37.1 % for CD8; 53.1 % for CD62L; 46.7 % for CD27; 38.9 % for CD28. The Student’s t test for mean was used for statistical analysis. b The fold expansion of ex vivo ttRNA–DC-expanded T cells for 10 days. Asterisks indicate p < 0.001 compared to IL-2 group. IL-2+ group: For the first 3 days of co-culture, IL-2 was supplemented, and then, IL-7 was added for the rest of culture

