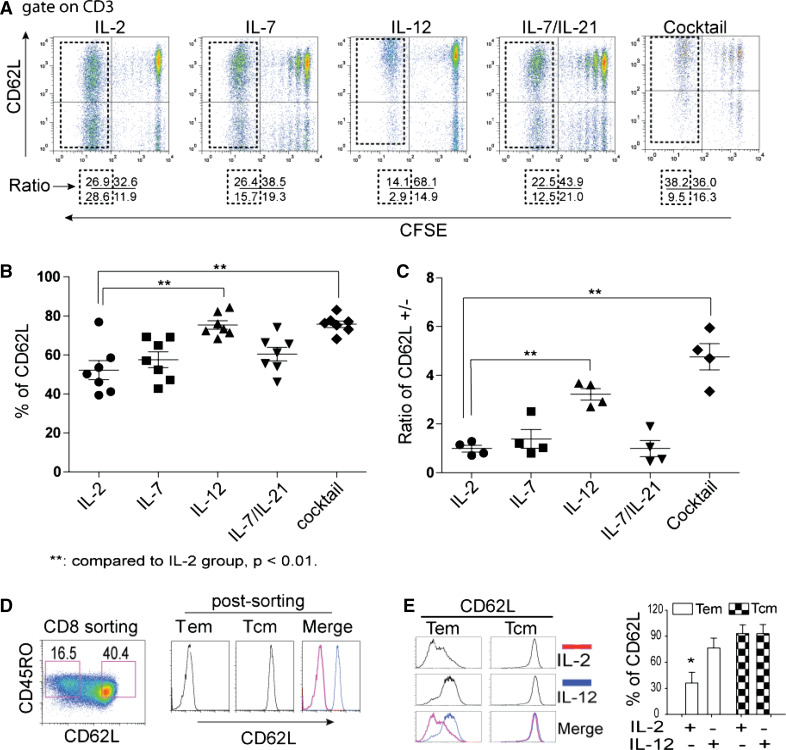
Fig. 3.
IL-12 is responsible for high levels of CD62L expression. a The effect of cytokines on dynamic expression of CD62L. T cells were stained with CFSE and co-cultured with ttRNA–DC. The proliferation in each group was monitored by CFSE dilution. The dot plots were displayed with the levels of CD62L on y axis and CFSE on x axis. The numbers below each dot plot represent the percentage of cells on each quadrant after 10 days ex vivo culture. The divided subsets were highlighted within the dotted squares. The use of cytokines or their combinations was denoted on top of each dot plot. b Statistical analysis of CD62L expression on the total population. The percentage of CD62L on the total population of T cells including divided and non-divided subsets was plotted. The data represent the average ± SD from 6 experiments. c The ratio of CD62L+ versus CD62L− subsets (CD62L+/−) from divided subsets. The ratio of CD62L+/− from divided T-cell subsets (as highlighted in the dotted squares) from 4 independent experiments was presented as average ± SD. d The sorting of CD62L+ and CD62L− subsets. The isolated CD8 T cells were stimulated with OKT3 and cultured in the presence of IL-2 for 7 days, and sorted using flow cytometry based on CD45RO+CD62L− (Tem) and CD45RO+CD62L+ (Tcm) subsets (left) and post-analyzed based on the expression of CD62L (right). e IL-12 leads to re-expression of CD62L on Tem. After sorting, Tem and Tcm were cultured in the presence of IL-2 (100 IU/ml) or IL-12 (20 ng/ml) for 5 days before the expression of CD62L was analyzed by flow cytometry. The figure on right represents the percentage of CD62L from 3 donors. Student’s t test for mean was performed, asterisks indicate p < 0.01

