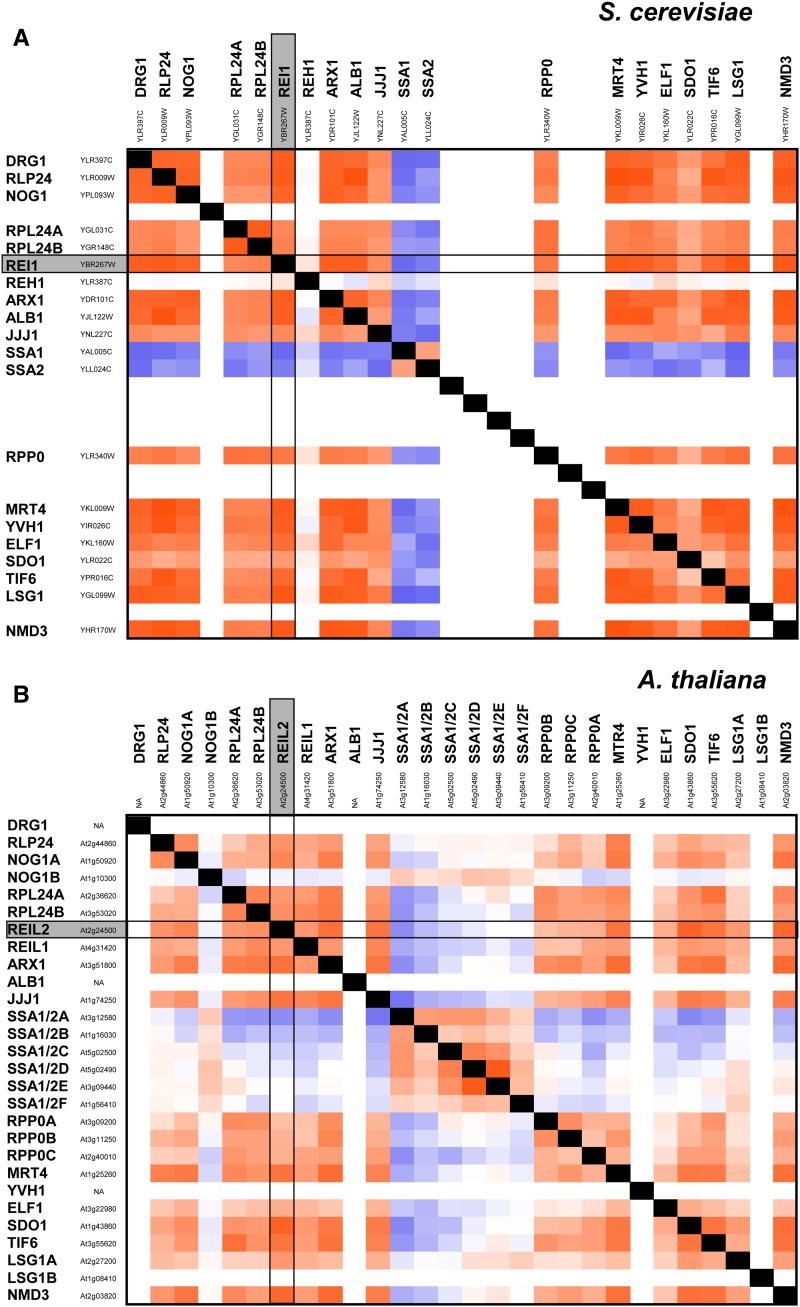
Figure 7.
Comparison of the coexpression matrix of the yeast 60S cytosolic maturation machinery to the coexpression matrix of A. thaliana paralogs. A, Yeast coexpression matrix under temperature control. B, A. thaliana coexpression matrix under temperature control. Note that average Spearman correlation coefficients (r) were calculated using independent transcript profiling experiments. The color scale represents positive coexpression with a maximum of +1.0 coded by red, with a minimal coexpression of –1.0 coded by blue and with white representing 0.0, i.e. the absence of coexpression. Empty cells were introduced in cases of gene families and for missing transcriptome data. Thirty-nine percent of the correlation coefficients match between A. thaliana and yeast with a deviation of r less than 0.250.

