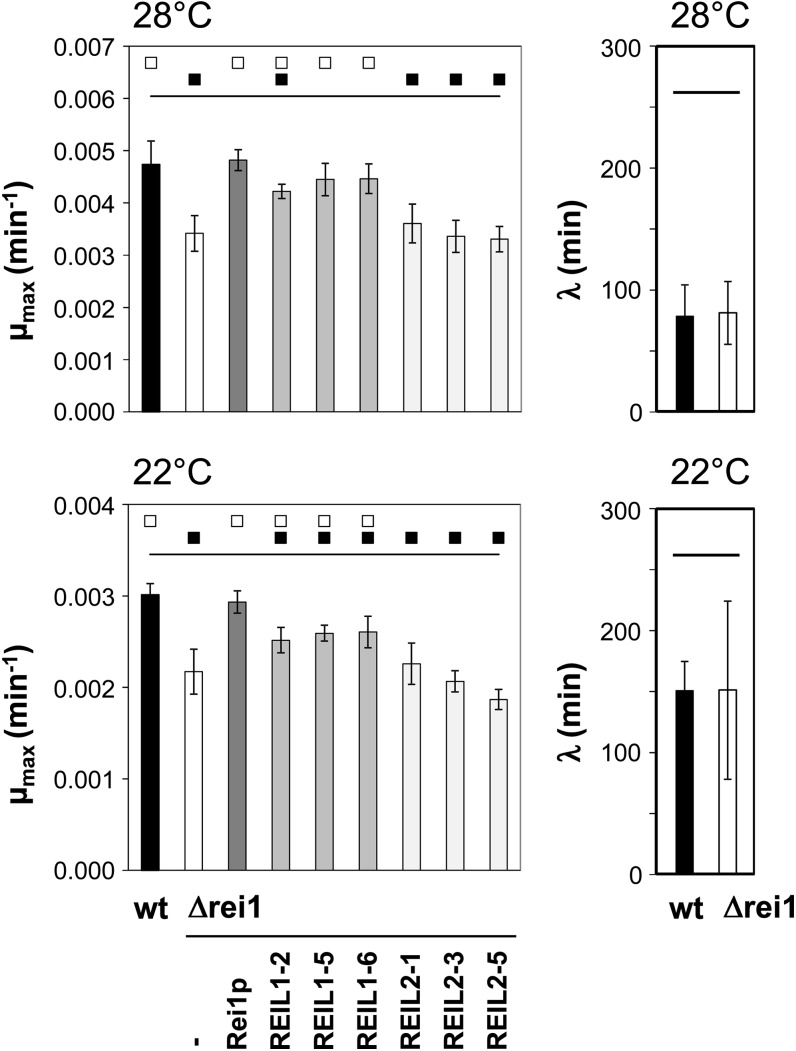
Figure 8.
Complementation of the growth phenotype of the yeast Δrei1 mutant by heterologous expression of REIL1 or REIL2. The growth phenotype was characterized by calculations of the maximum relative growth rate (µmax) and the lag phase (λ) from semilogarithmic plots of growth curves (compare with Supplemental Fig. S11). The complementation is compared at suboptimal temperatures, 28°C and 22°C, to the BY4742 wild type (wt, black bars), the yeast Δrei1 mutant (–, white bars), and the yeast Δrei1 mutant complemented by homologous expression of yeast rei1 (Rei1p, dark gray bars). Note that the white squares at the top of each graph indicate significant differences compared with the Δrei1 mutant, i.e. complementation. Black squares indicate fully or partially maintained significant differences compared with the wild type. Three independently transformed strains expressing REIL1 or REIL2 were tested (P < 0.01, n = 16–32).

