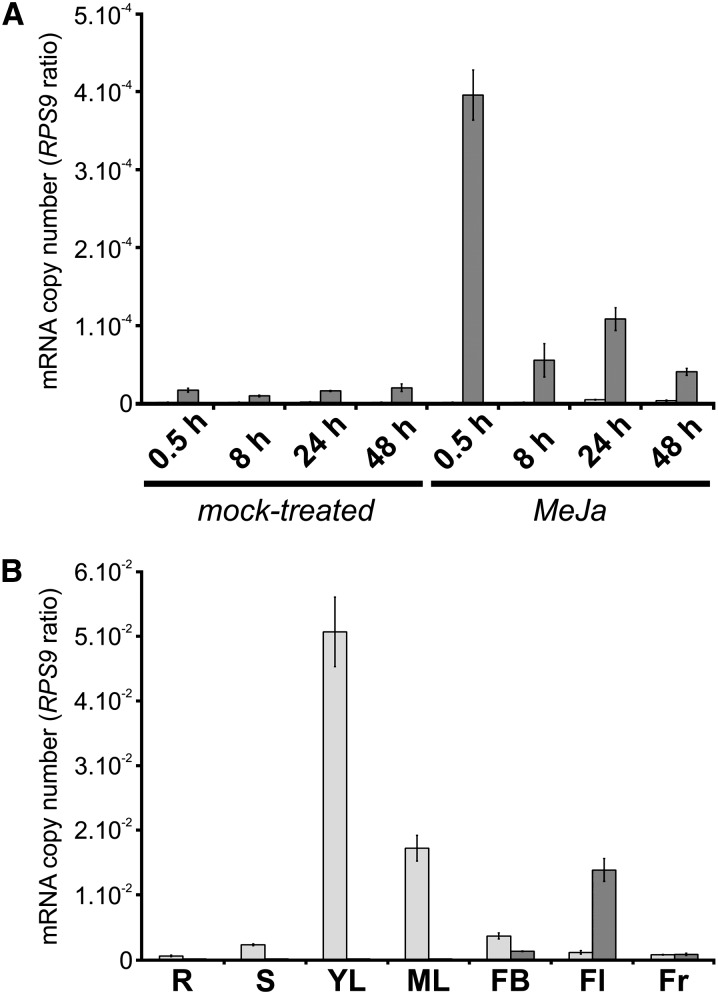
Figure 3.
Analysis of CYP71D351 (T16H2) and CYP71D12 (T16H1) expression in C. roseus organs and cell cultures. CYP71D351 (light gray bars) and CYP71D12 (dark gray bars) transcript levels were determined by real-time RT-PCR analyses performed on total RNA extracted from C. roseus cells subjected to MeJa or mock treatment during 0.5, 8, 24, and 48 h (A) and from C. roseus organs (B). CYP71D351 and CYP71D12 transcript copy numbers were normalized using CrRPS9. R, Roots; S, stems; YL, young leaves; ML, mature leaves; FB, flower buds; Fl, flowers; Fr, fruits.

