Figure 1.
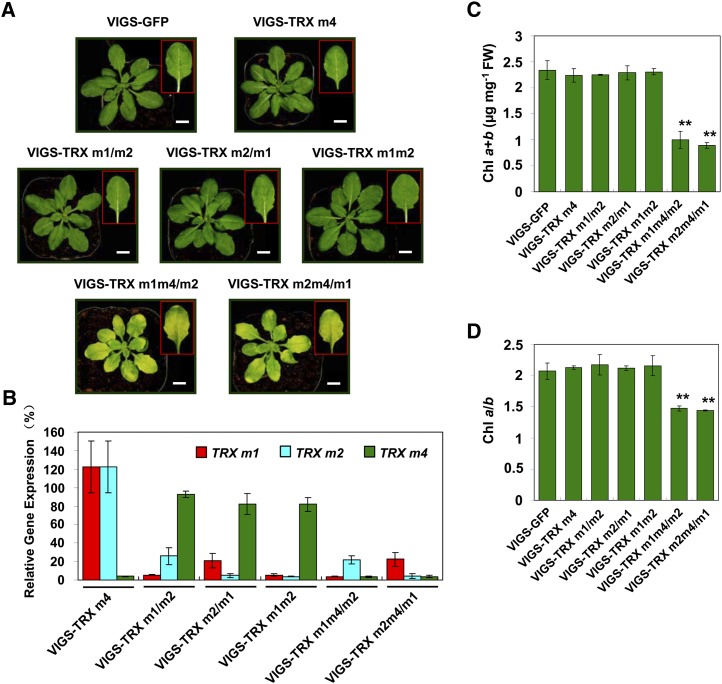
Characterization of the Arabidopsis VIGS-TRX m plants. A, Representative photographs of VIGS-GFP, VIGS-TRX m4, VIGS-TRX m1/m2, VIGS-TRX m2/m1, VIGS-TRX m1m2, VIGS-TRX m1m4/m2, and VIGS-TRX m2m4/m1 plants, which were infected with the pTRV2-GFP, pTRV2-TRX m4, pTRV2-TRX m1, pTRV2-TRX m2, pTRV2-TRX m1m2, pTRV2-TRX m1m4, and pTRV2-TRX m2m4 vectors, respectively, via agroinfiltration. Photographs of representative leaves from VIGS plants are shown in the insets. All the plants were observed 3 weeks after infiltration. At least three biological replicates were performed, and similar results were obtained. Bars = 1 cm. B, The suppression rate of TRX m genes in VIGS-TRX m plants was analyzed by quantitative real-time RT-PCR. The relative transcript levels of TRX m1, TRX m2, and TRX m4 in VIGS-TRX m4, VIGS-TRX m1/m2, VIGS-TRX m2/m1, VIGS-TRX m1m2, VIGS-TRX m1m4/m2, and VIGS-TRX m2m4/m1 plants were normalized to the level in VIGS-GFP plants (100%). The data represent means ± sd of three biological replicates. C and D, Total chlorophyll (Chl) content (C) and chlorophyll a/b ratio (D) in VIGS-TRX m and VIGS-GFP plants. FW, Fresh weight. The data represent means ± sd of three biological replicates. Statistical significance compared with the VIGS-GFP plants is indicated by asterisks (**P ≤ 0.01, Student’s t test).

