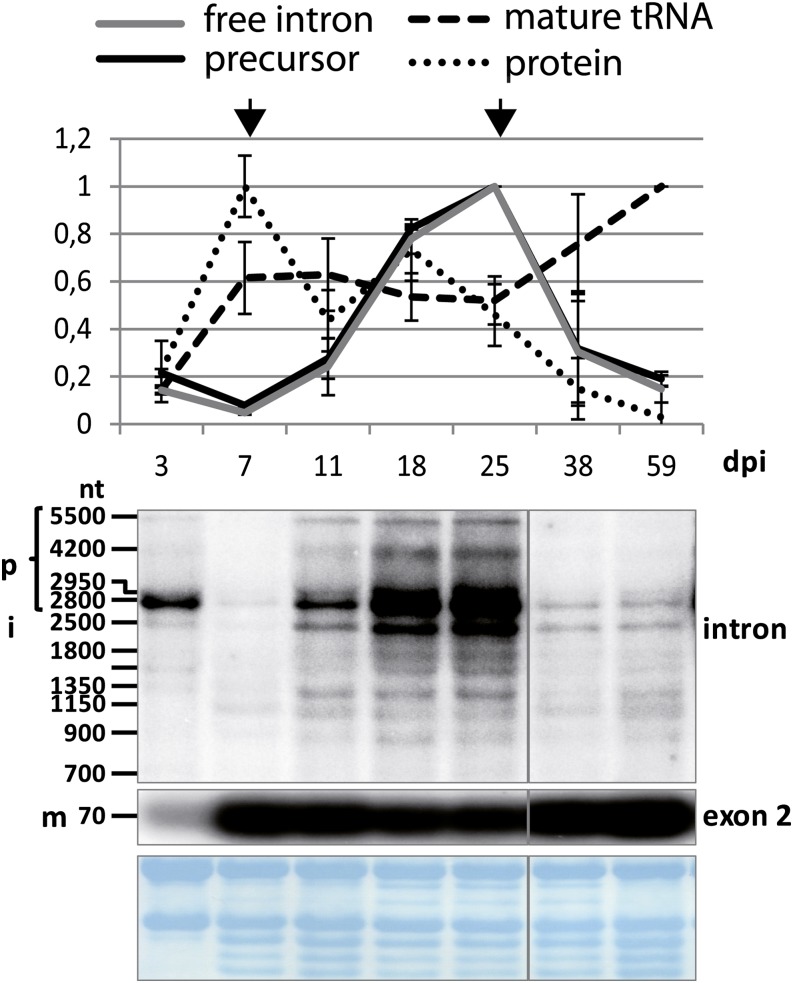
Figure 1.
RNA gel-blot analysis of matK across tobacco development. Total RNA (5 μg per lane) from seedlings of different ages (dpi) and from leaves of older plants was extracted, separated on an agarose gel, blotted to a nylon membrane, and hybridized with different radioactive probes. RNA gel-blot analyses with an exon and an intron probe were carried out. Bands that could be identified as unspliced precursor RNAs (p), free intron (i), and mature, spliced RNA (m) are indicated on the left. nt, Nucleotides. Probe positions for each autoradiogram are indicated on the right. The labeled bands were densitometrically quantified on a phosphorimager. Values were normalized to the top value of all seedling samples, which was arbitrarily set to 1. These values are displayed in the chart shown at top (black graph = precursor RNA; gray graph = free intron; dashed graph = mature tRNA). The experiment was replicated with independent RNA samples (data not shown), which allowed the determination of sd values shown here. As a loading control, blots were stained with methylene blue prior to hybridization; this is shown below the autoradiograms. Protein values (dotted line) are taken from western analyses published previously (Zoschke et al., 2010). Arrows indicate the largest discrepancies in the dynamics of protein and mRNA levels. [See online article for color version of this figure.]

