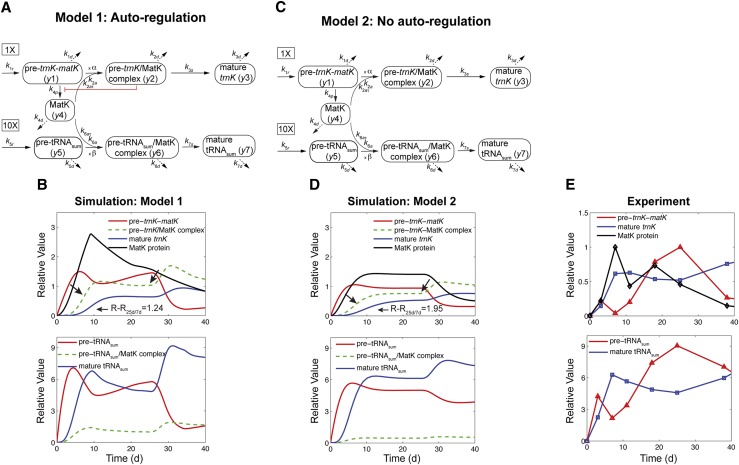
Figure 5.
Model 1 with autoregulation of MatK reproduces the observed expression dynamics. Two possible models of matK gene expression were analyzed with respect to how well both models fit to our experimental data. A, Reaction scheme of the tRNA-MatK splicing network for model 1. The MatK transtargets trnA, trnV, and trnI are lumped into one tRNA species assigned as tRNAsum. The values of trnA accumulation (Fig. 3A) were used to describe the expression dynamics of tRNAsum, and tRNAsum is assumed to be 10-fold more abundant than trnK (for details, see “Results”). k1r and k5r are the transcription rates of the tRNA precursors pre-trnK-matK (y1) and pre-tRNAsum (y5), respectively. The protein MatK (y4) is encoded within the intron of the trnK-matK precursor gene and translated with the rate k4p. As the levels of the tRNA precursors y1 and y5 as well as the MatK protein y4 increase, they form pre-trnK/MatK (y2) and pre-tRNAsum/MatK complexes (y6), respectively. The pre-trnK/MatK repression complex (y2) inhibits the translation of matK via a negative feedback loop (red line with a blunt end). The subscript τ in k2aτ and k6aτ is the delay introduced in the models to signify the time taken for the formation of pre-trnK/MatK and pre-tRNAsum/MatK complexes at day 25 of tobacco development. Within the tRNA/protein complexes, MatK splices the introns with rates k3s and k7s, leading to spliced tRNAs: mature trnK (y3) and mature tRNAsum (y7). Competition of pre-trnK-matK (y1) and tRNAsum (y5) for MatK (y4) is assigned by the factors  and
and  . To simplify the model, the involvement of nucleus-encoded splicing factors was not considered. Complex dissociation was assumed to be slow and, therefore, was neglected. Dashed arrows represent the degradation of RNAs, complexes, and the MatK protein with rates k1d to k7d. B, Accumulation of tRNA precursors, mature tRNAs, MatK protein, and tRNA/MatK complexes during tobacco development, derived from theoretical predictions of model 1 in comparison with northern-blot and western-blot analyses (E). Model 1 (top) fits certain experimental data displayed in E, such as the inverse correlation of MatK expression and matK mRNA (pre-matK-trnK) accumulation around day 7, the sharp decline of the MatK protein level after day 7, and the enrichment of pre-trnK/MatK complexes in mature seedlings. The model consistently reproduces the ratio-to-ratio value between pre-trnK/MatK complexes at days 25 and 7 (RR25d/7d = 1.24), indicated with black arrows. Model 1 (bottom) shows temporal expression profiles of tRNAsum (trnA, trnV, and trnI). The days of maximal accumulation of tRNAsum are the same as those for trnK and those experimentally observed. C, Model 2 shows the same reaction scheme depicted in A, but negative autoregulation is removed from the system. D, Accumulation of tRNA precursors, mature tRNAs, MatK protein, and tRNA/MatK complexes during tobacco development derived from theoretical predictions of model 2 (C) in comparison with northern-blot and western-blot analyses (E). Model 2 (without autoregulation) fails to capture the distinctive expression dynamics of matK mRNA (pre-trnK-matK) and MatK protein. E, Experimental data for the accumulation of tRNA precursors, mature tRNAs, and MatK protein during tobacco development derived from northern-blot and western-blot analyses. The accumulation of MatK is plotted relative to the maximum obtained 7 dpi, while the abundance of the RNA precursor (pre-trnK-matK) and mature trnK is plotted relative to the maximum 25 and 59 dpi, respectively (set to 1). Reference parameters of the reaction kinetics of model 1 and model 2 are given in “Materials and Methods.” Note the different scaling.

