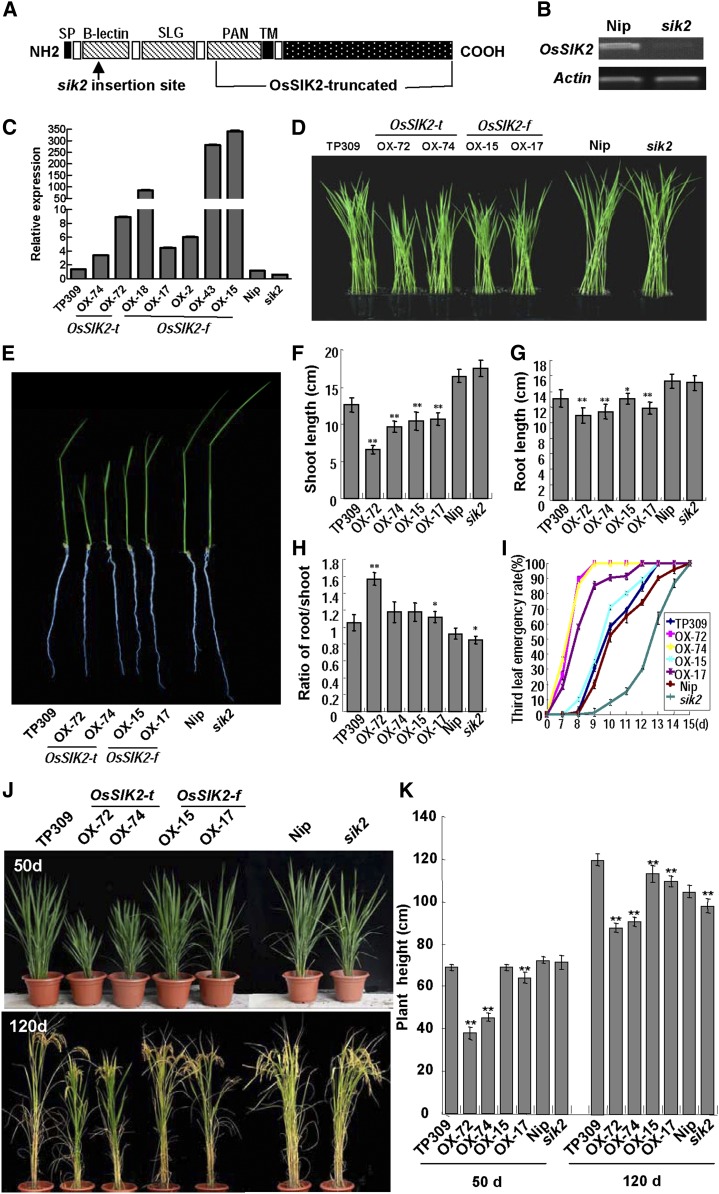
Figure 2.
Generation of OsSIK2-overexpressing plants, mutant sik2 identification, and phenotype analysis. A, Schematic of mutant sik2 insertion and the OsSIK2-truncated protein (OsSIK2-t). SP, Signal peptide; TM, transmembrane domain. The arrow indicates the Tos17 insertion site. The full length of OsSIK2 is represented by OsSIK2-f below. B, The sik2 mutant has no expression of OsSIK2 as revealed by reverse transcription-PCR. The ACTIN gene was amplified as a control. C, OsSIK2 expression in OsSIK2-overexpressing lines and the mutant sik2 by qRT-PCR. OsSIK2-t indicates a transgenic line with a truncated OsSIK2 gene. OsSIK2-f indicates a transgenic line with a full-length OsSIK2 gene. OX indicates OsSIK2-overexpressing transgenic lines. For each column, error bars indicate sd (n = 3). D, Comparison of the phenotypes of young seedlings. Fourteen-day-old plants were used. E, Comparison of various plant lines. Nine-day-old plants grown in soil were used for photography. F, Shoot length of 9-d-old plants. G, Root length of 9-d-old plants. H, Ratio of root length to shoot length in 9-d-old seedlings. I, Third leaf emergence rates in various plants. In total, 30 seedlings for each line were surveyed at the indicated time points. J, Phenotypes of field-grown plants. Field-grown 50-d-old (top) and 120-d-old (bottom) plants were regrown in pots for photography. K, Measurement of plant height. For F, G, H, and K, each column represents an average of at least 15 plants. Error bars indicate sd. Asterisks indicate significant differences from the corresponding controls (Nip or TP309) at *P < 0.05 and **P < 0.01.

