Figure 7.
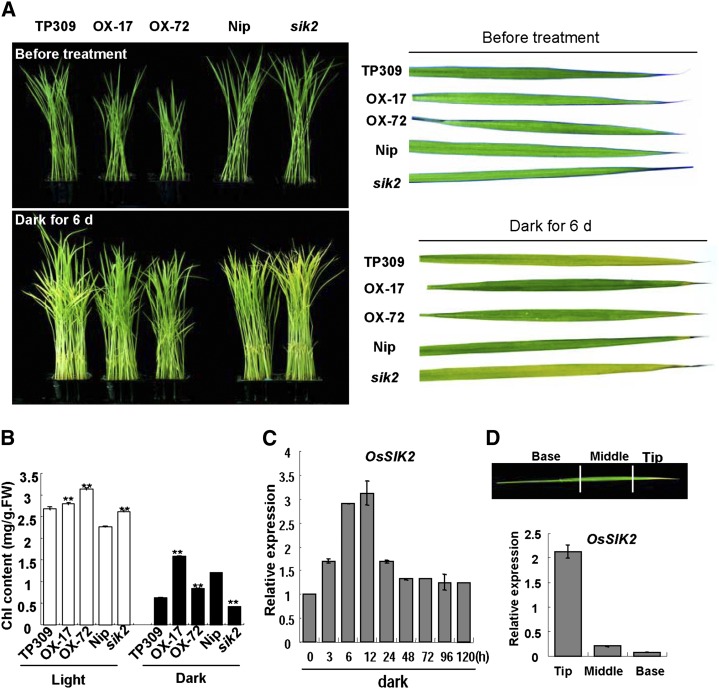
Delayed leaf senescence in OsSIK2 transgenic plants in the dark. A, Comparison of plants after dark treatment. Top left, 14-d-old plants before treatment; top right, second leaves from top left plants; bottom left, plants in the dark for 6 d; bottom right, second leaves from bottom left plants. B, Chlorophyll (Chl) contents in the second leaves of rice seedlings. Each column represents an average of three replicates. Error bars indicate sd. Asterisks indicate significant differences from the corresponding controls (Nip or TP309) at *P < 0.05 and **P < 0.01. FW, Fresh weight. C, Expression of OsSIK2 in response to dark treatment. Two-week-old TP309 plants were treated, and leaves were pooled for RNA extraction. Expression was determined by qRT-PCR. D, Expression pattern of OsSIK2 in a senescing leaf. One-month-old leaves showing approximately 20% senescence were dissected into three parts as indicated, and OsSIK2 expression was measured. For C and D, error bars indicate sd (n = 3).

