Figure 8.
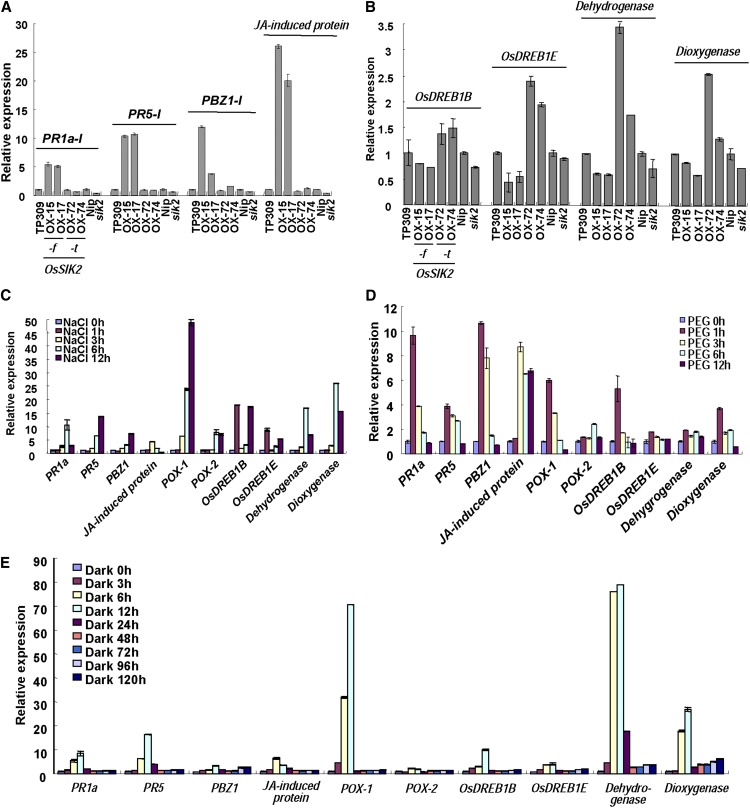
OsSIK2 alters the expression of downstream genes. Two-week-old plants were treated, and gene expression was determined by qRT-PCR. Each column represents an average of three replicates. Error bars indicate sd. A, Genes specifically up-regulated in OsSIK2-f transgenic plants (OX-15 and OX-17). B, Genes specifically up-regulated in OsSIK2-t transgenic plants (OX-72 and OX-74). C, Induction of gene expression under NaCl stress in TP309 seedlings. D, Induction of gene expression with PEG (20%) treatment in TP309 seedlings. E, Dark-induced gene expression in TP309 seedlings.

