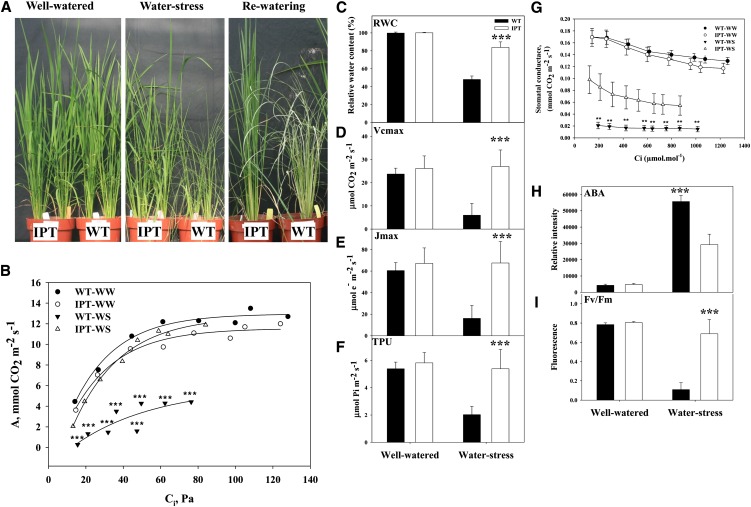
Figure 1.
Analysis of carbon assimilation in flag leaves of wild-type (WT) and transgenic PSARK::IPT rice plants subjected to 3 d of water stress. A, Plants grown under well-watered conditions, 3 d of water stress, and 3 d after rewatering at pre anthesis (booting) stage. B, A/Ci curves of wild-type well-watered (WW; black circles), wild-type stressed (WS; black triangles), PSARK::IPT well-watered (white circles), and PSARK::IPT stressed (white triangles) plants. C, RWC. D, Vcmax. E, Jmax. F, TPU. G, Stomatal conductance (mmol water m−2 s−1). H, ABA content. I, Fv/Fm. Values are means ± sd (n = 7). Seven individual plants per genotype/treatment were used in each of the measurements, and the data were analyzed using one-way ANOVA followed by Student’s t test. Asterisks indicate significant differences between genotypes per treatment (**P ≤ 0.01, ***P ≤ 0.001).

