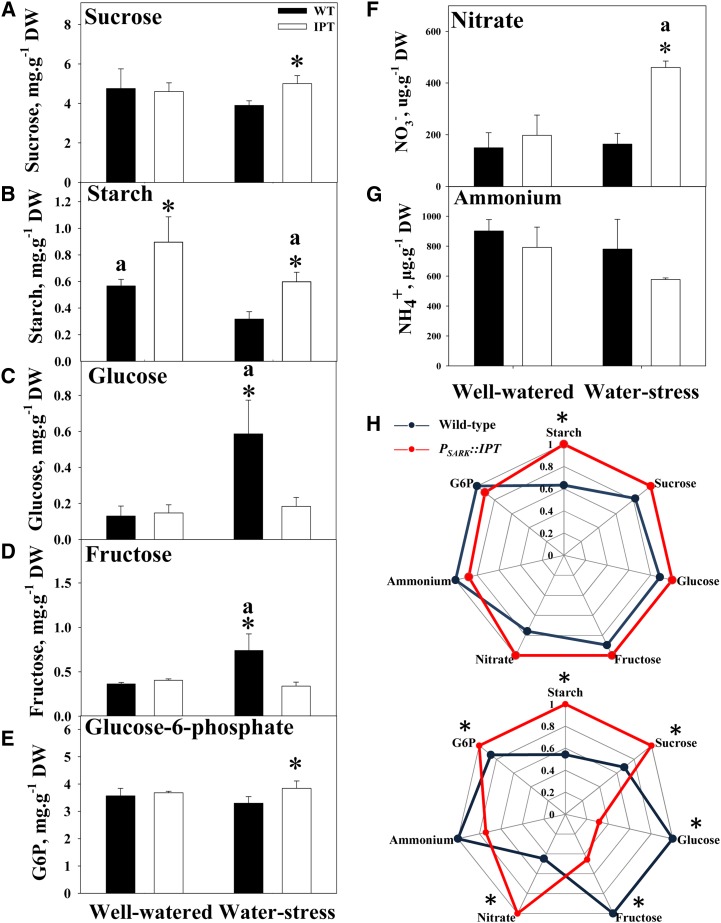
Figure 2.
Sugar and N-related metabolite contents in flag leaf tissue at the pre anthesis stage of wild-type (WT) and transgenic PSARK::IPT plants. A, Suc. B, Starch. C, Glc. D, Fru. E, Glc-6-P. F, Nitrate. G, Ammonium. H, Radar charts comparing the metabolic profile of wild-type (blue) and transgenic PSARK::IPT (red) plants under control (well-watered) conditions (top) and water-stress conditions (bottom). Values are means ± sd (n = 6). Six individual plants per genotype/treatment were used in each of the measurements, and the data were analyzed using one-way ANOVA followed by Student’s t test. Asterisks indicate significant differences by genotypes (*P ≤ 0.05); a indicates significant differences between treatments (P ≤ 0.05). DW, Dry weight.

